
![]()

Bay Bridge and San Francisco downtown at morning. View from treasure island
San Francisco Real Estate
Home Prices, Sales & Statistics; Stock Markets; Interest Rates and Unicorns in Spring
April 2019, Q1 Report
A substantial portion of Q1 statistics reflect new listings and accepted offers occurring during the mid-winter market doldrums (Thanksgiving to mid-January). In November and December 2018, the stock market plunged drastically from its all-time high in September, and interest rates hit their highest point in years: these factors negatively affected buyer demand. Then both turned in dramatically positive directions in early 2019. So, Q1 statistics reflect economic conditions in both Q4 2018 (very negative) and Q1 2019 (very positive). It is also the quarter with the lowest sales volume.
The spring selling season – whose data starts to show up in March, but is mostly reflected in Q2 – is the most active of the year, and also typically sees the highest rates of appreciation. As always, there are many economic factors at play impacting Bay Area markets, some of which are discussed below.
Year-over-Year & Longer-Term Trends
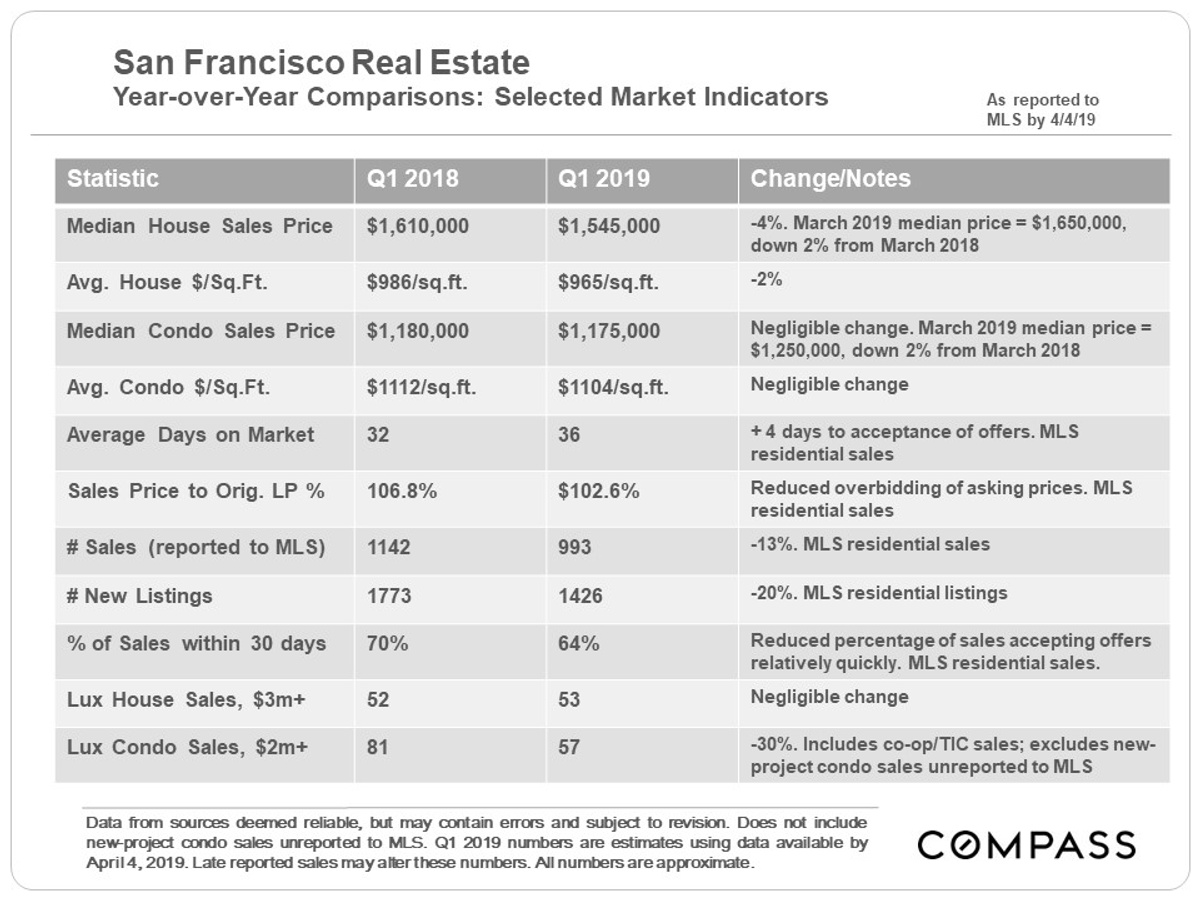
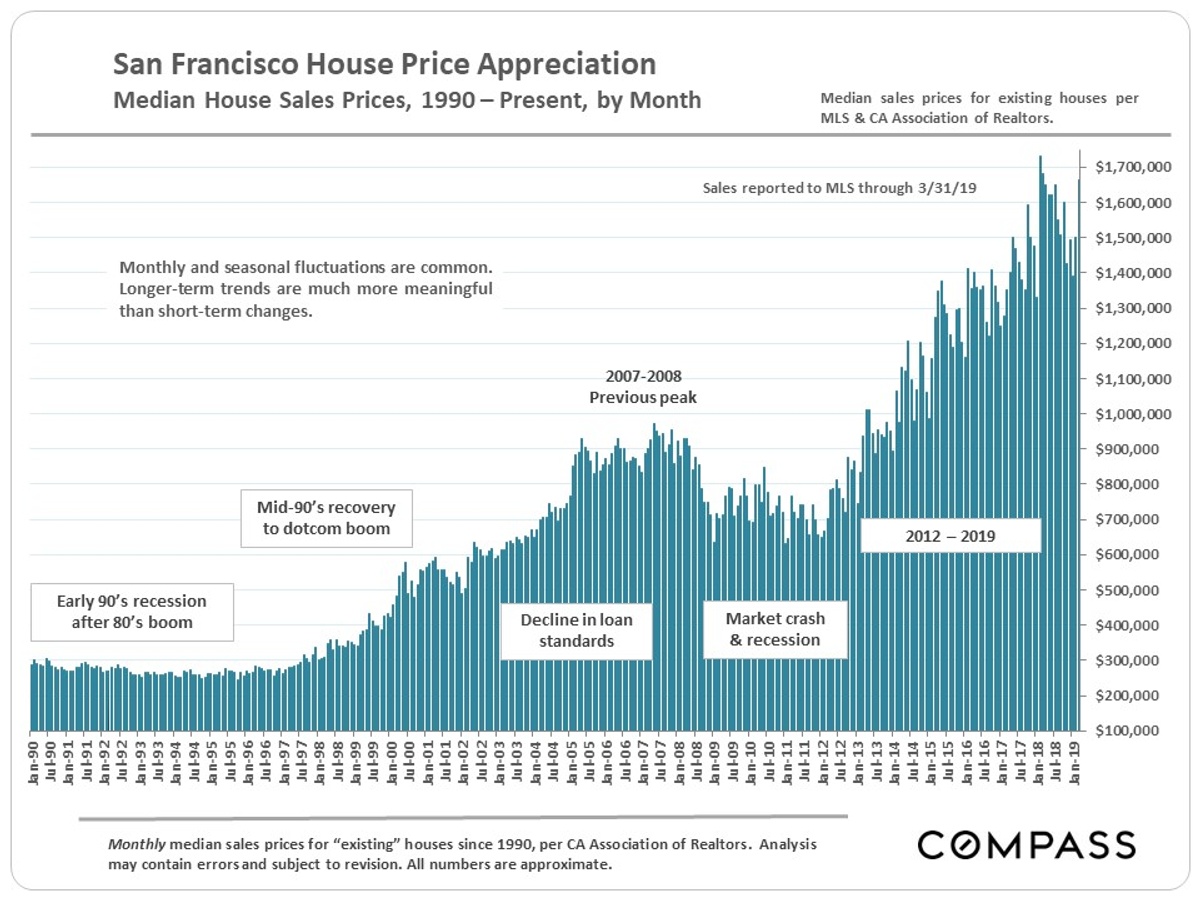
Median Sales Prices
Median house sales prices dropped dramatically from last spring, but then spiked up again in March 2019. Spring is typically the season when median prices increase most.
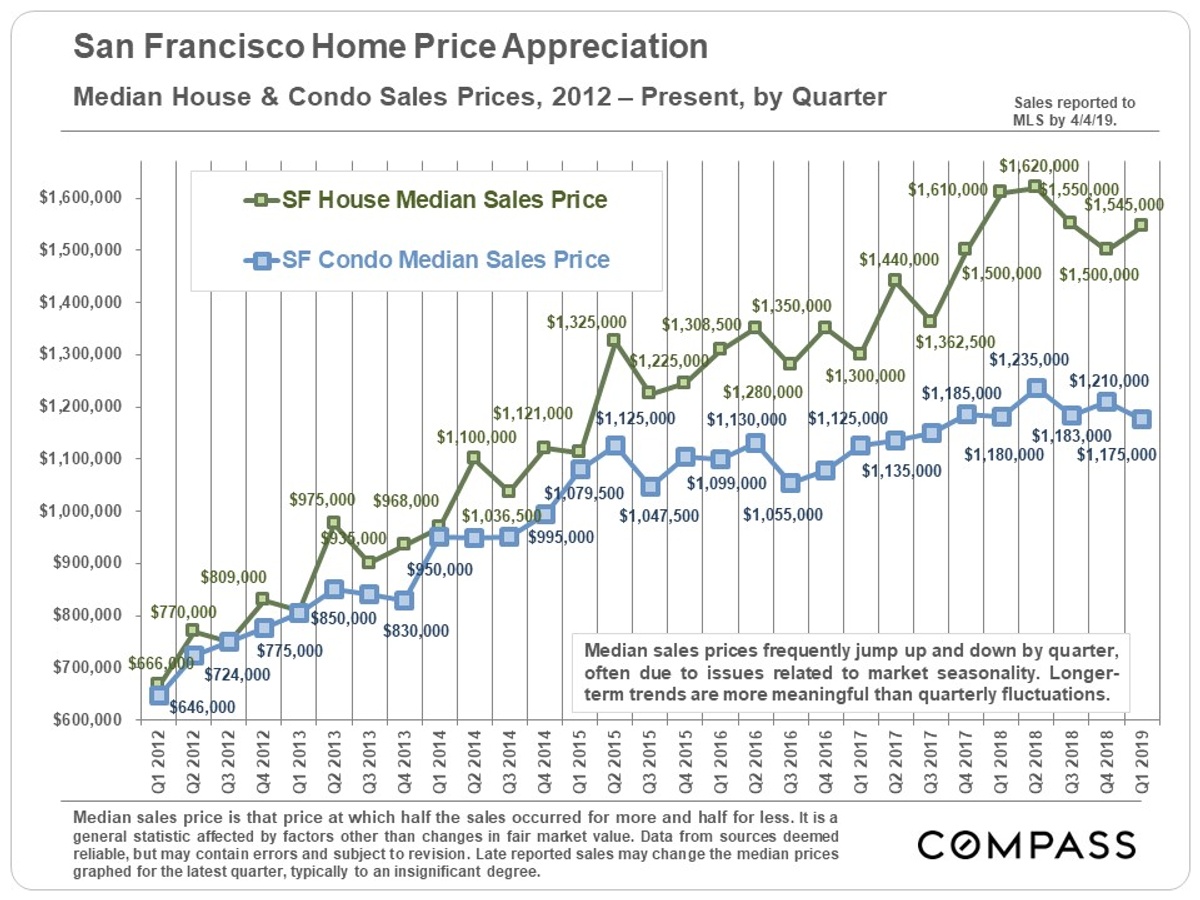
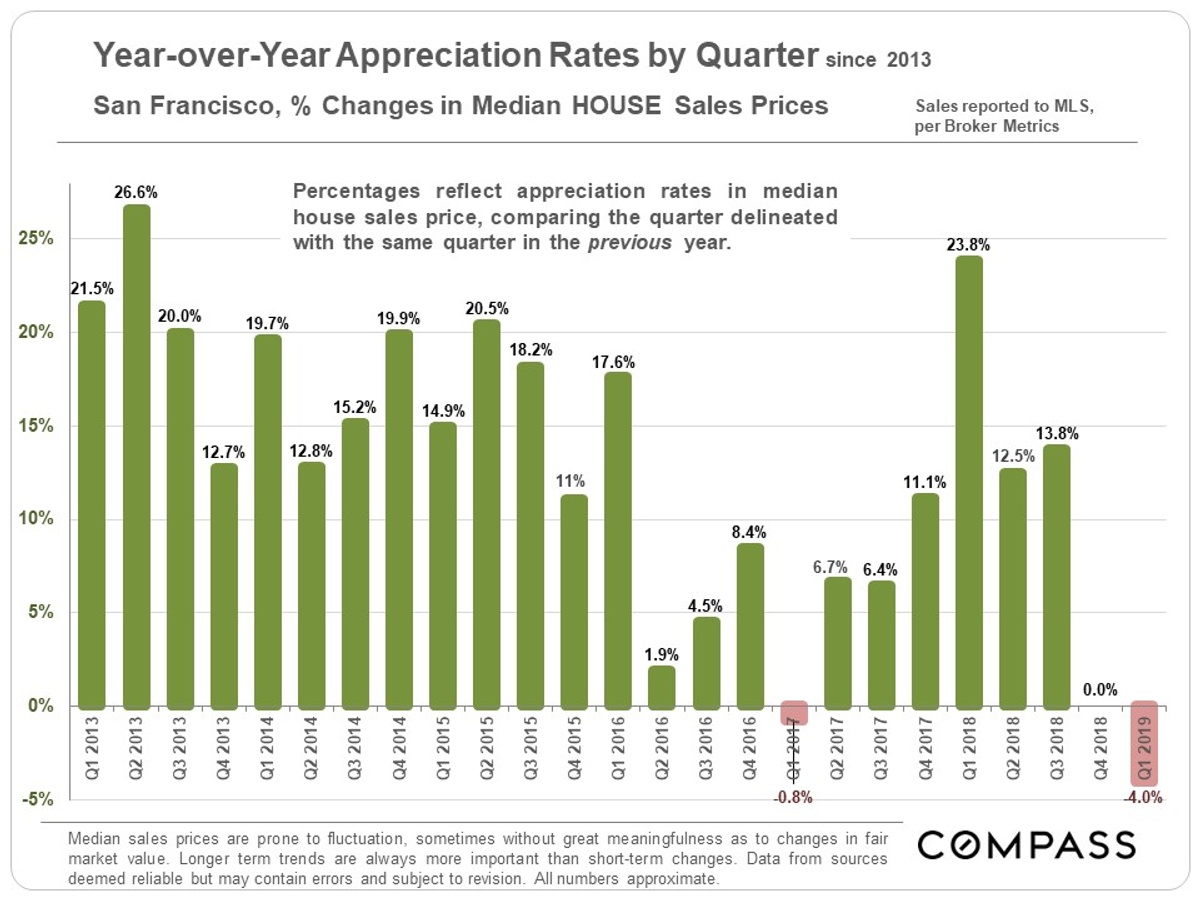
The biggest change since last spring as been a switch from high year-over-year quarterly appreciation rates to zero appreciation and a slight decline in the last 2 quarters. What occurs this spring will be critical to understanding market trends.
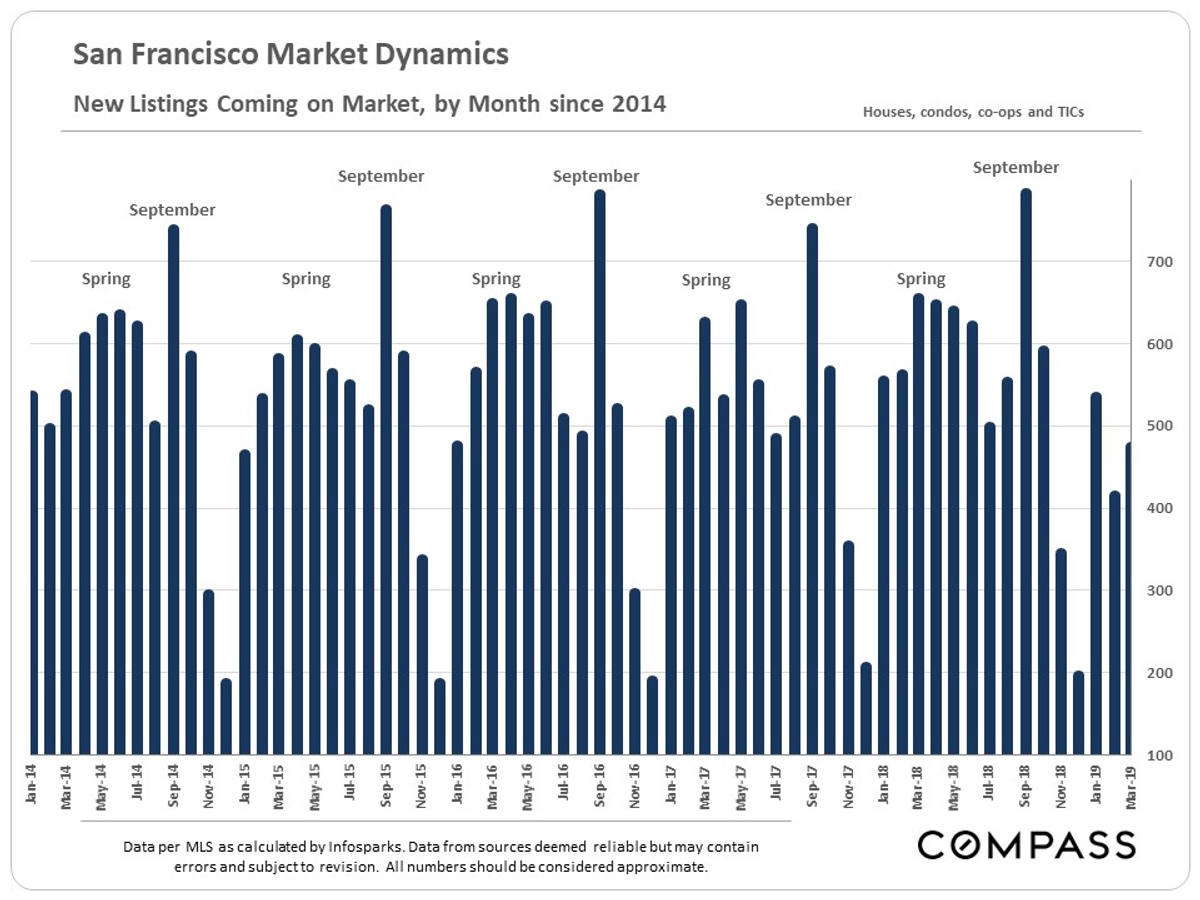
New Listings Coming on Market
Year-over-year, there was a plunge in the number of new listings coming on market in Q1 – new listings almost always climb from January through March, but not this year. Were sellers waiting for a hoped-for rush of new IPO millionaires to appear? Will new listing inventory jump now that the IPOs have begun to occur? Q2 will provide much more data regarding the media-frenzy “IPO effect.”
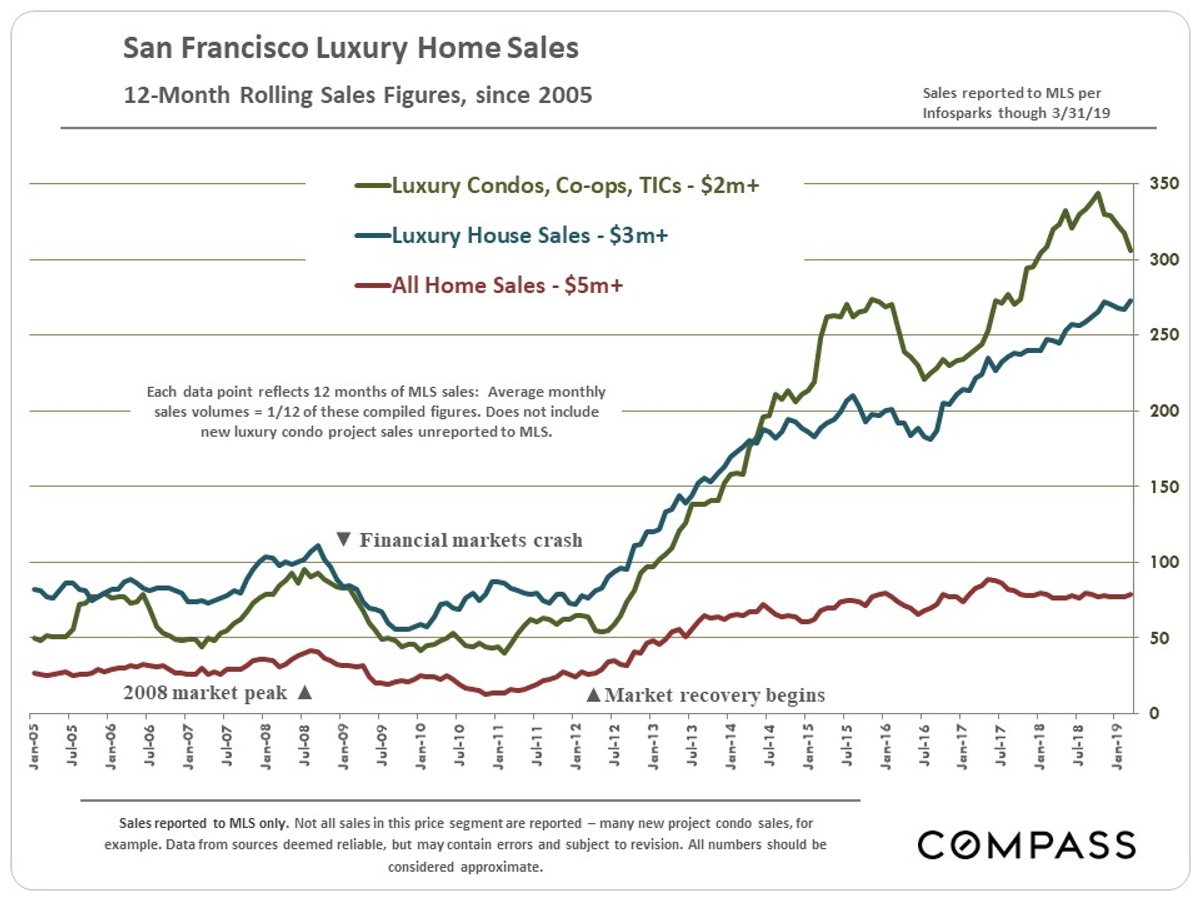
Luxury Home Sales
There has been a significant drop in MLS sales of luxury condos. The jump in the number of new, luxury (and ultra-luxury) condos being built is creating a surge of supply that has increased the competition between sellers for buyers’ attention. (Many new-project luxury condos are neither listed nor their sales reported to MLS, and so are not reflected in this chart.)
Selected Economic Factors
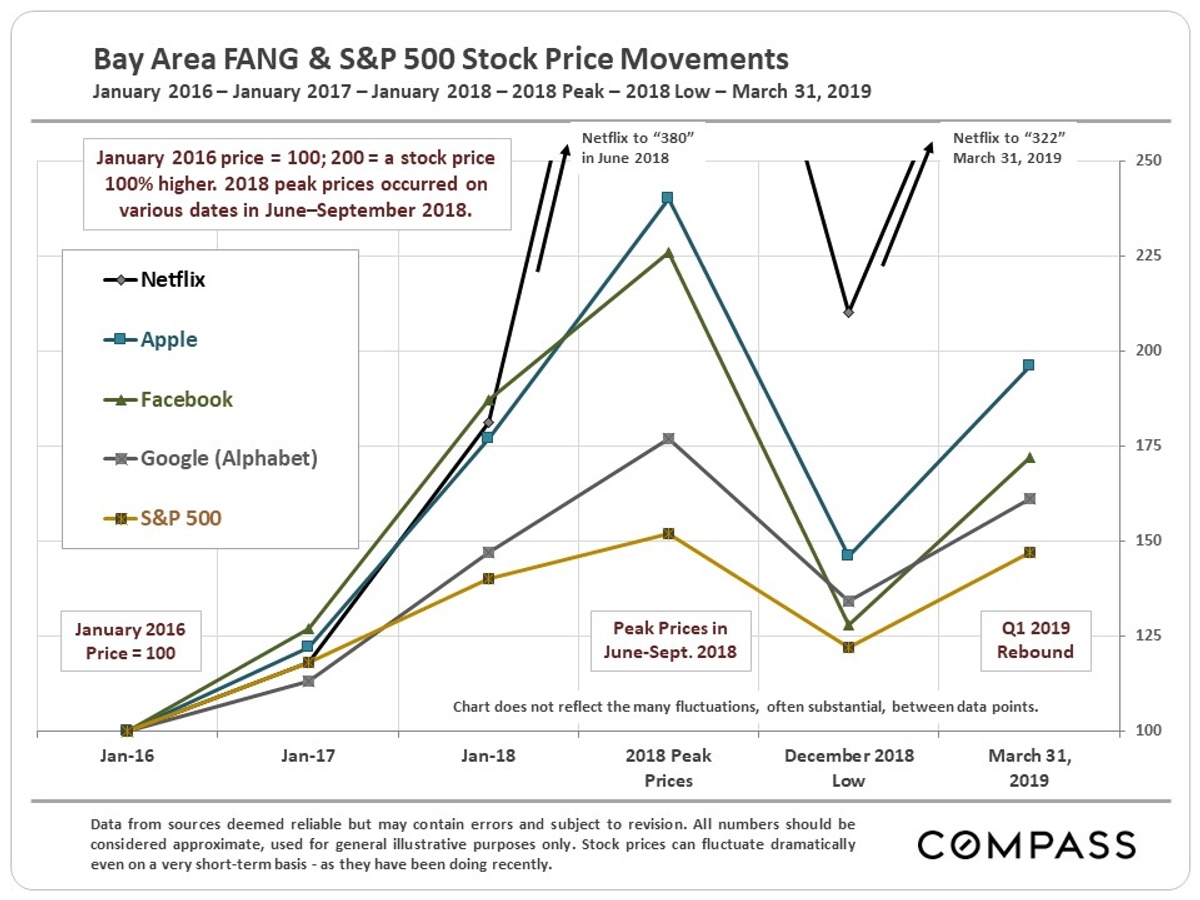
Stock Markets & Unicorn IPOs
A wild ride in stock prices, particularly in high-tech: Prices soared to new peaks in summer-early autumn 2018, plunged drastically in Q4 2018, and then saw the biggest Q1 jump in 20 years. Huge amounts of wealth appearing, disappearing and reappearing – a major influence on consumer confidence and home-buyer demand.
A new surge of large, high-tech unicorn IPOs – mostly of firms headquartered in SF – has just started to roll out. IPOs have historically created vast quantities of new wealth in the Bay Area, though the magnitude of the effect of this new wave on the SF housing market is yet unknown – but currently fiercely disputed. Anecdotally, there have certainly been reports of buyers moving more quickly to beat the “rush of new millionaires” and of sellers waiting to list in order to catch the rush (see New Listing chart above).
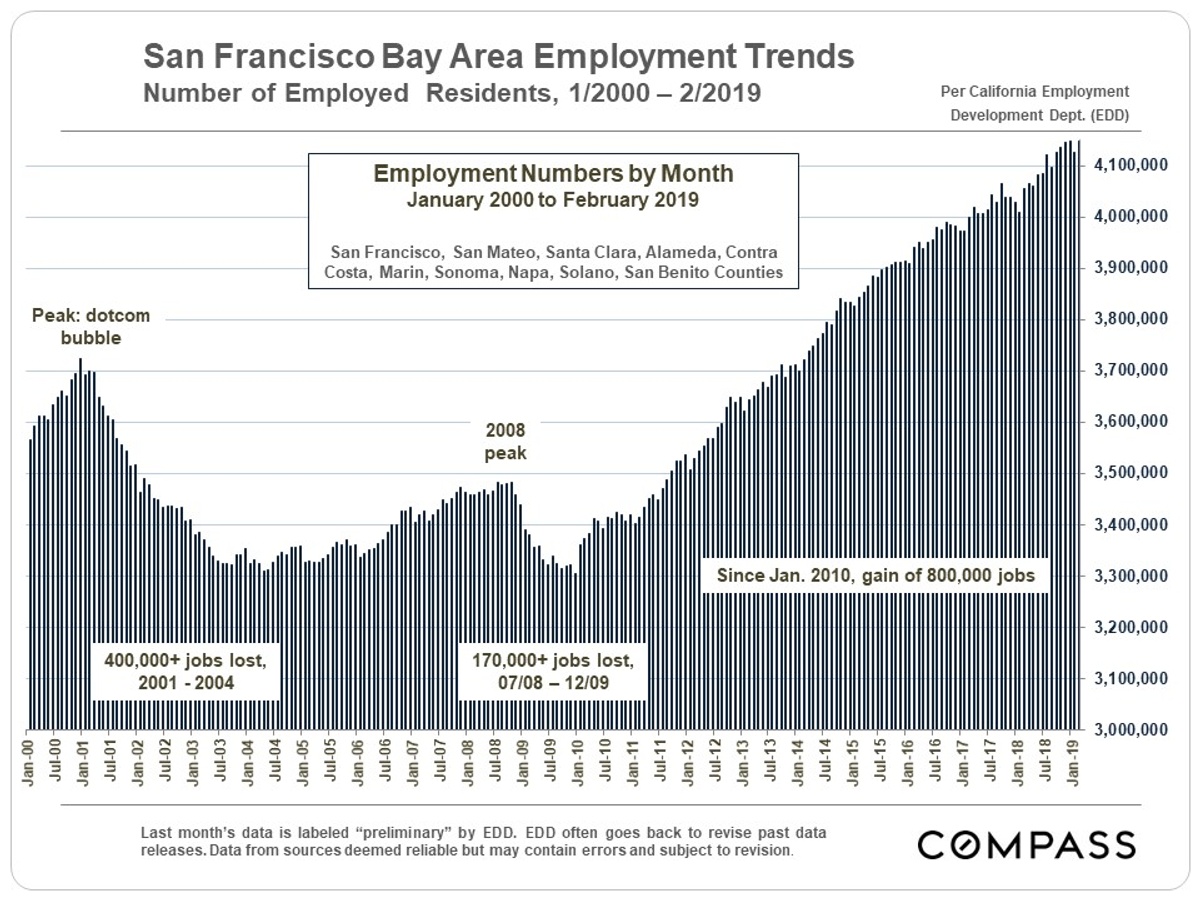
Employment
A gigantic factor underlying Bay Area housing markets has been the staggering increase in employed residents since 2010. Outward-bound migration trends of residents and businesses – often citing housing costs as one major motivator – have been an increasing concern in recent years, but for the time being, employment numbers have continued to grow.
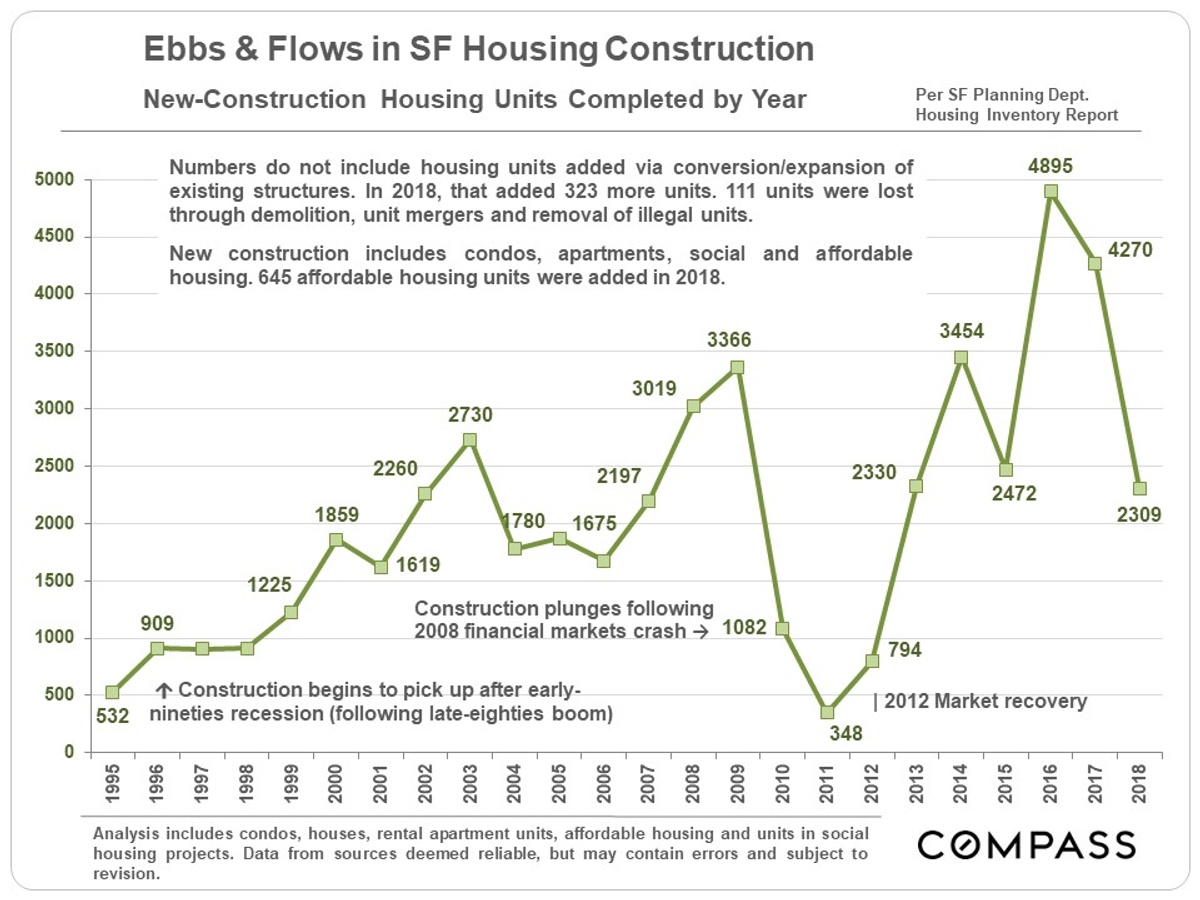
New Home Construction
Due to a number of factors, including a rapid increase in land and construction costs, new housing construction in SF dropped dramatically in 2018. The quantity of new homes being built plays a significant role in the supply and demand equation, and thus home prices.
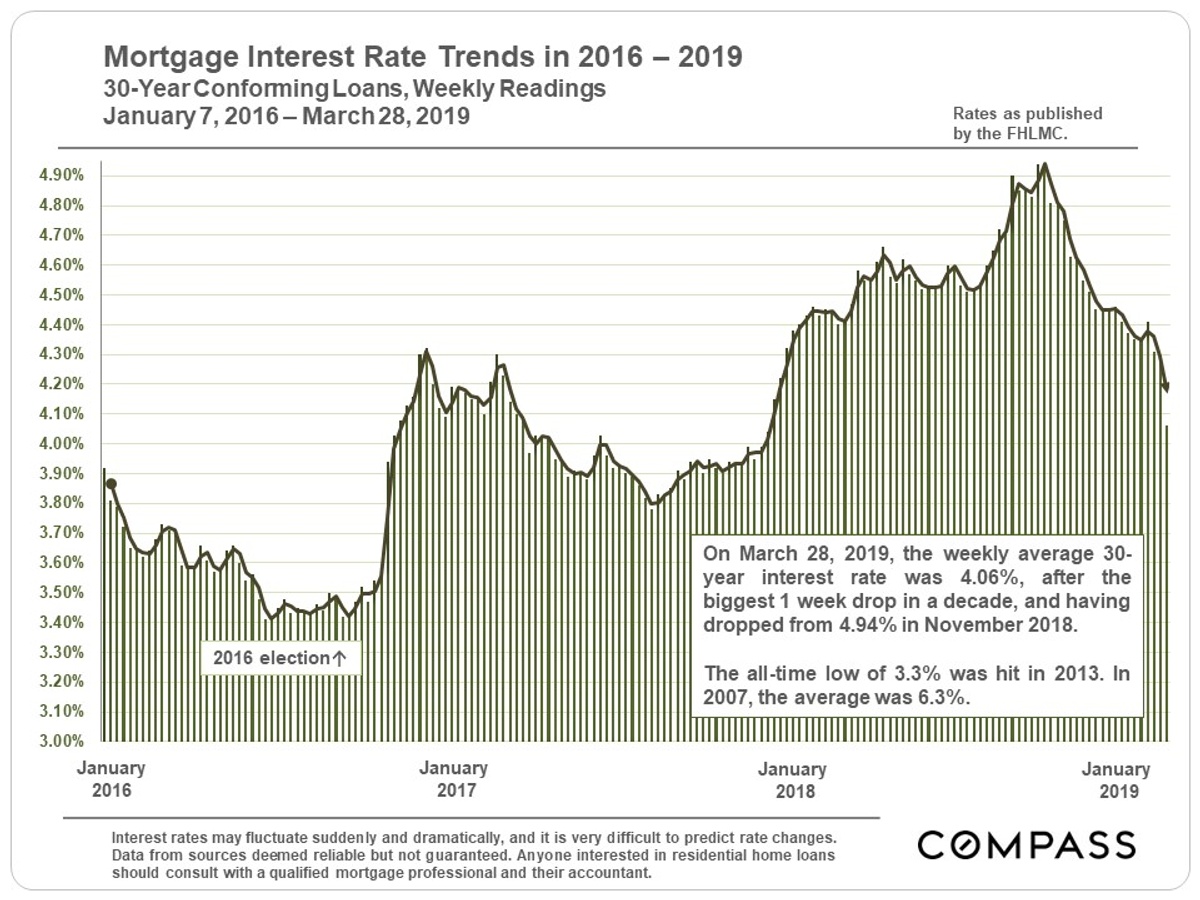
Interest Rates
There has been a stunning decline in mortgage interest rates from mid-November 2018 through the end of March, from 4.94% to 4.06% – to the enormous advantage to buyers. Big drops such as this have helped to recharge buyer demand in the past.
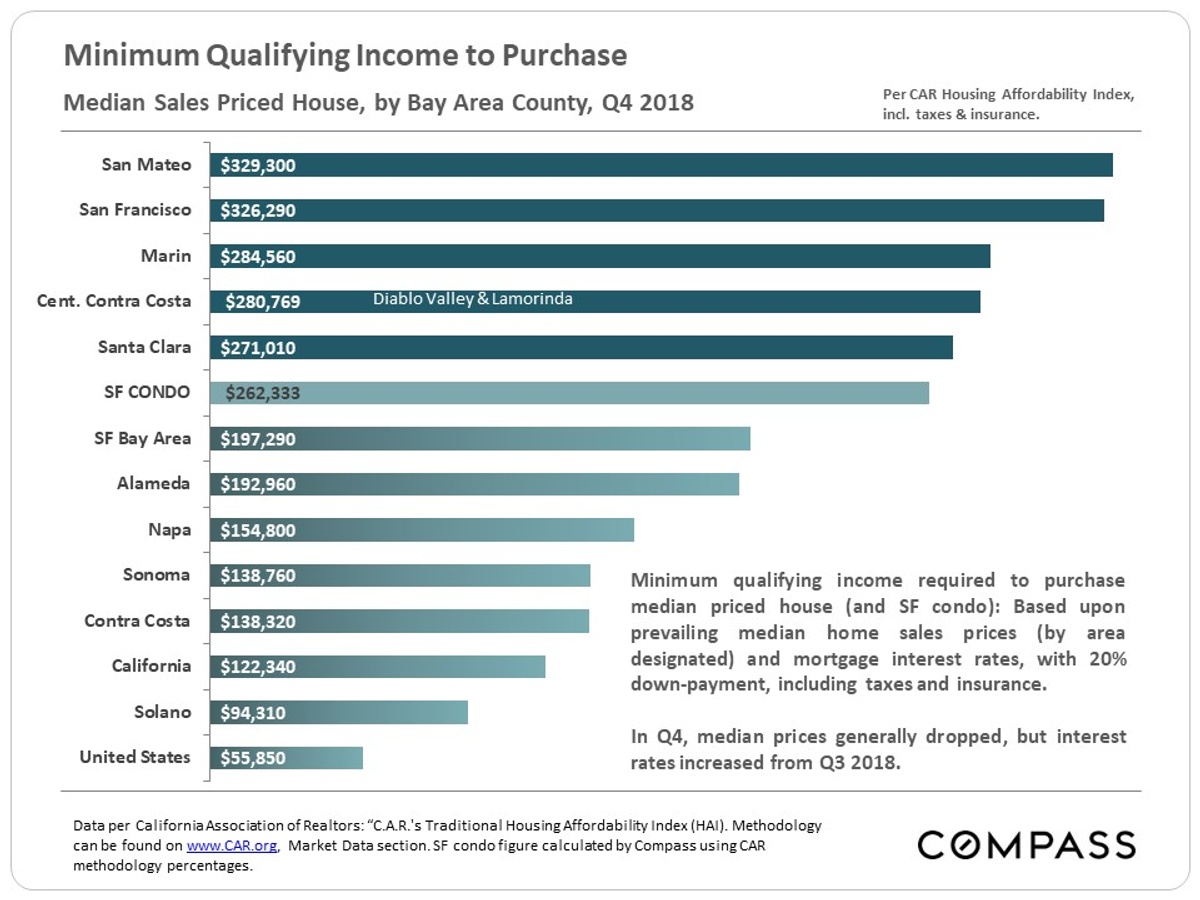
Housing Affordability & Household Incomes
This chart calculates the income required to buy a median-price house in Q4 2018. Median condo prices are substantially less in every county and would require lower incomes.
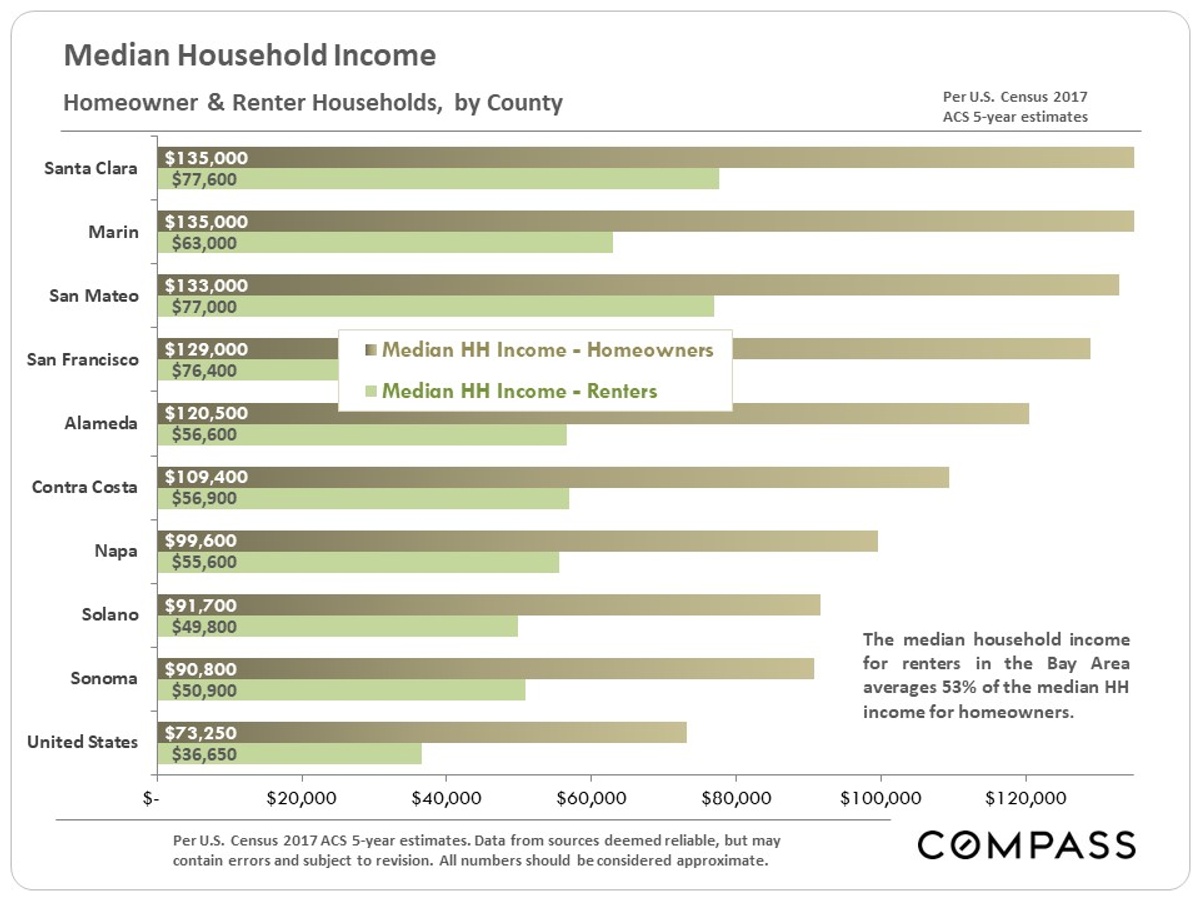
County median household incomes are broken out below for homeowners and tenants – some Bay Area county incomes are among the highest in the country. However, comparing the chart below to the one above illustrates the disparity between prevailing incomes and the incomes required to purchase in the Bay Area.
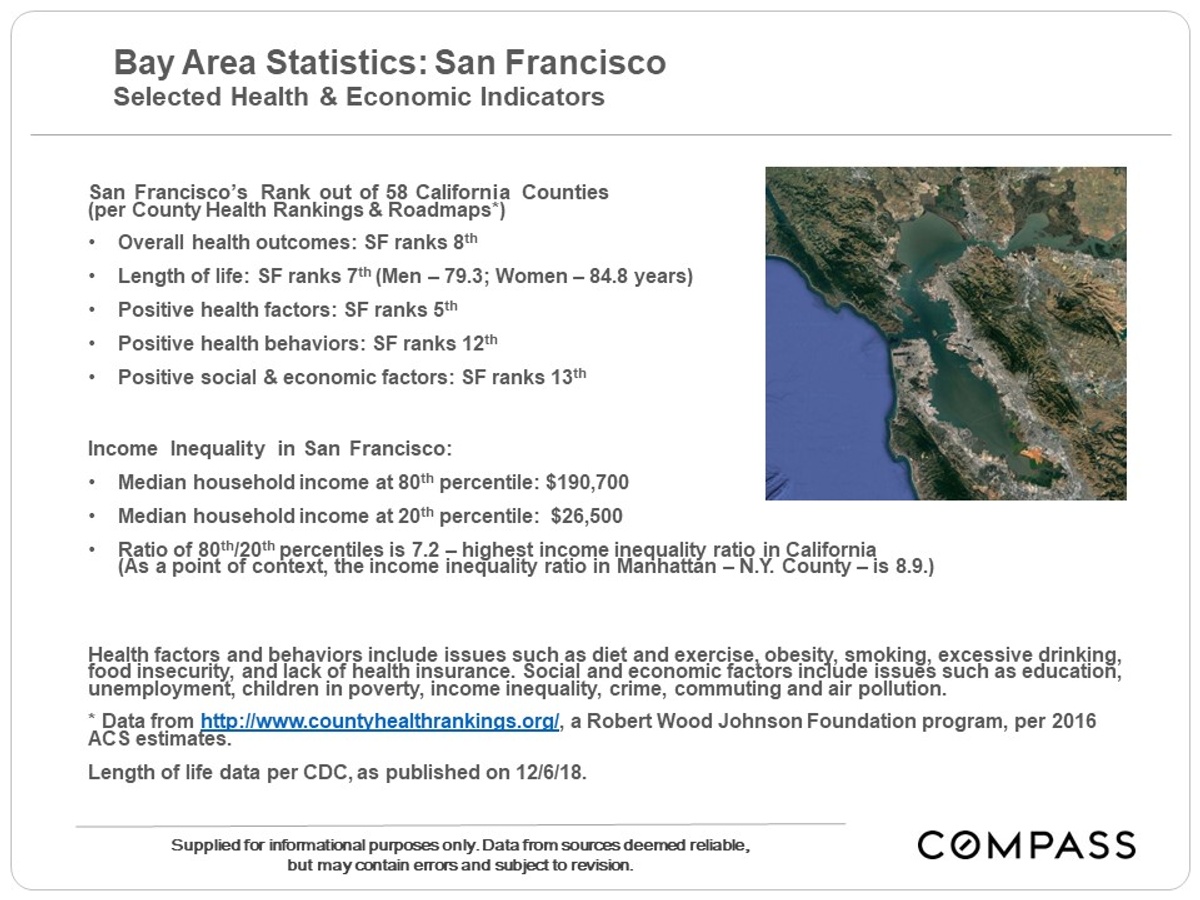
Health & Economic Indicators
According to a 2018 ranking of state health conditions by the Commonwealth Fund, California ranks 14th in the nation (1st being best – Hawaii). According to CountyHealthRankings.org, Bay Area counties are at the top of the list within CA for Overall Health Outcomes: Marin, San Mateo and Santa Clara rank 1, 2 & 3, while SF is 8th. On the less positive side, SF has the highest income inequality ratio in the state.

Jeff Salgado
DRE#: 01501886
415.915.9916
jeff(at)jeffsalgado(dotted)com
© Compass 2018 ¦ All Rights Reserved by Compass ¦ Made in NYC
Compass is a licensed real estate broker (01991628) in the State of California and abides by Equal Housing Opportunity laws. All material presented herein is intended for informational purposes only. Information is compiled from sources deemed reliable but is subject to errors, omissions, changes in price, condition, sale, or withdraw without notice. No statement is made as to accuracy of any description. All measurements and square footages are approximate. Exact dimensions can be obtained by retaining the services of an architect or engineer. This is not intended to solicit property already listed