
![]()

869976984
San Francisco Real Estate
Sales & Values by District and Price Segment, Special Circumstance Sales, Market Seasonality, the Luxury Home Market & Foreign Buyers
August 2019 Report
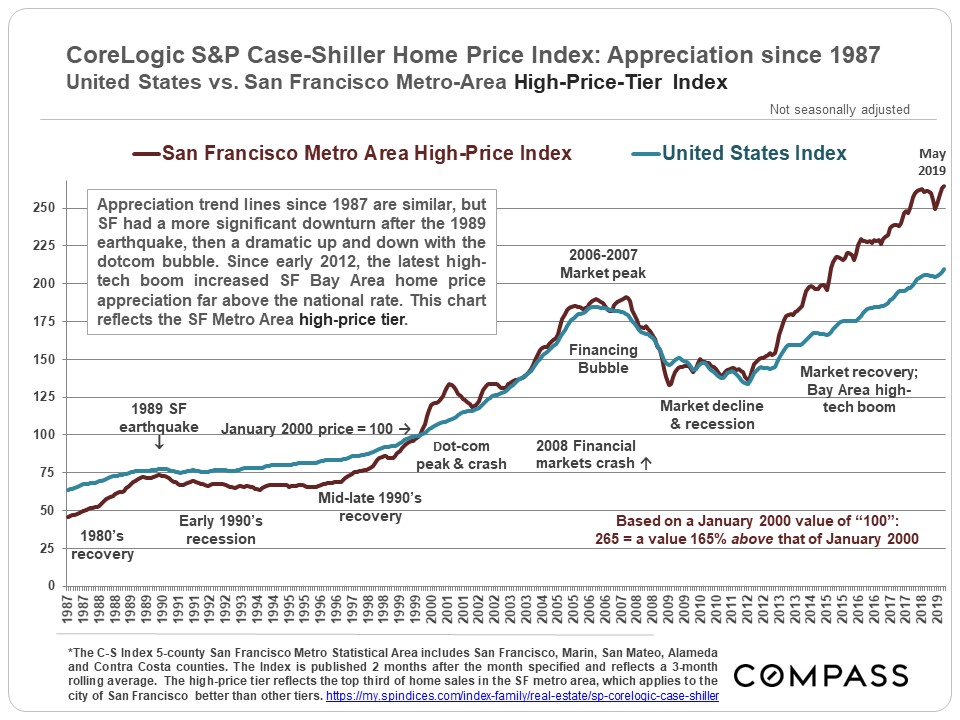
The May Case-Shiller Home Price Index was released in late July for the 5-county SF metro area. This chart illustrates the difference in appreciation rates between the Bay Area (higher price markets) and the entire country. Case-Shiller does not use median sales prices but its own algorithm to calculate appreciation. January 2000 home price = 100; 250 = a home price 150% above that of Jan. 2000.
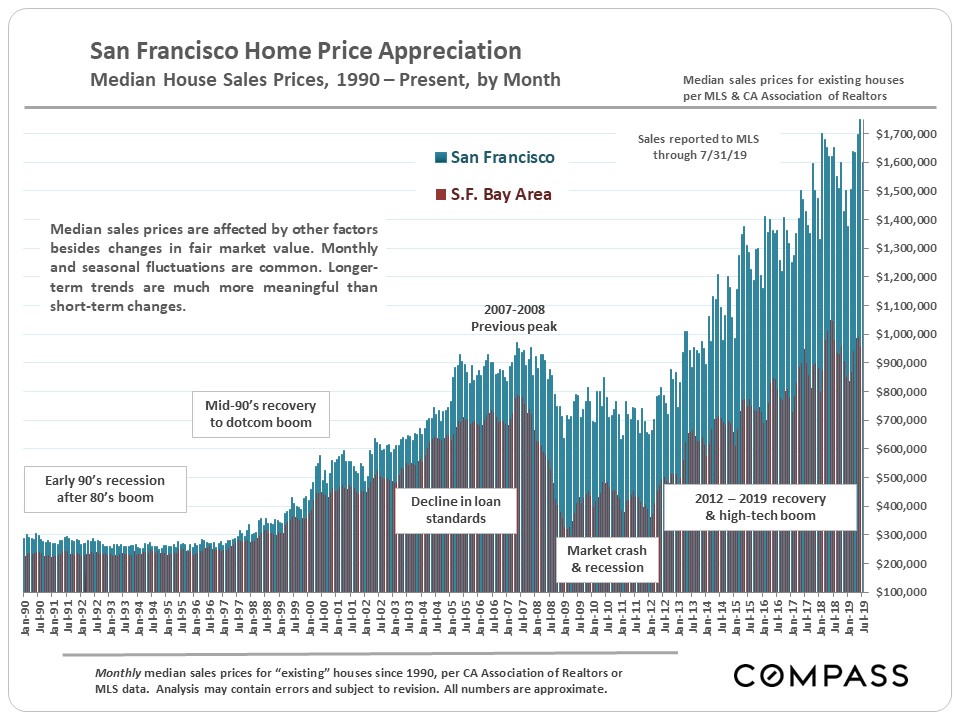
Needless to say, there are many factors behind home sales and values in different communities. Home size is one of them, and median sales prices are not apples to apples comparisons: For example, in Pacific Heights, the average house size is over 4000 square feet, while in Sunnyside, it runs about 1500 square feet.
Note that it is not uncommon for median sales prices to peak for the year in Q2.
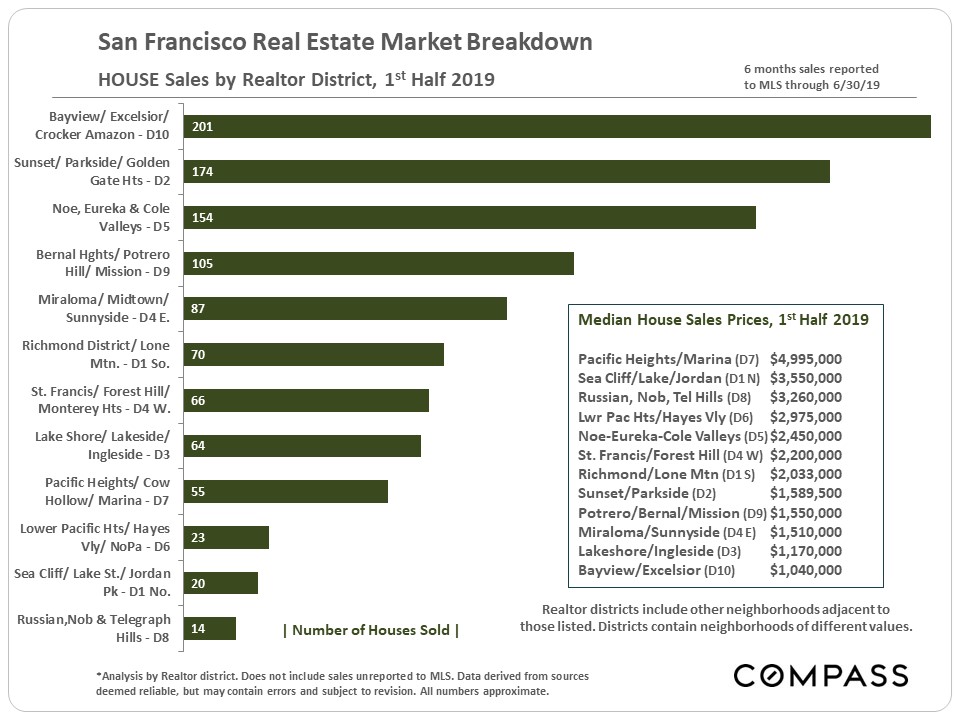
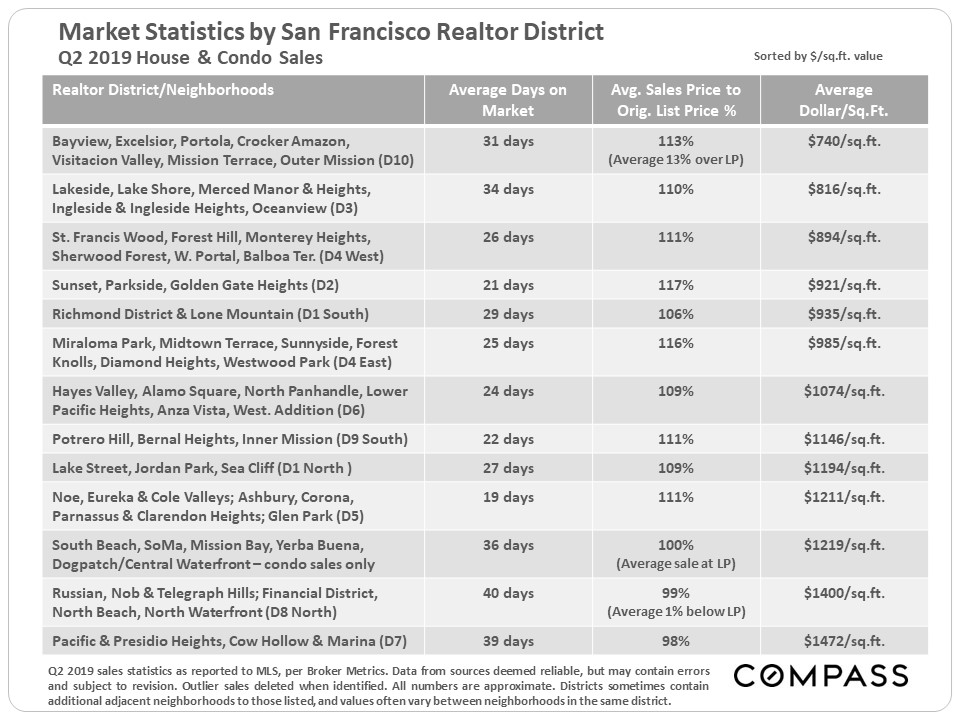
Market Dynamics by Realtor District
Q2 is commonly the hottest market of the calendar year – characterized by strong demand and an inadequate supply of inventory – and the statistics below generally reflect a very strong spring 2019 market.
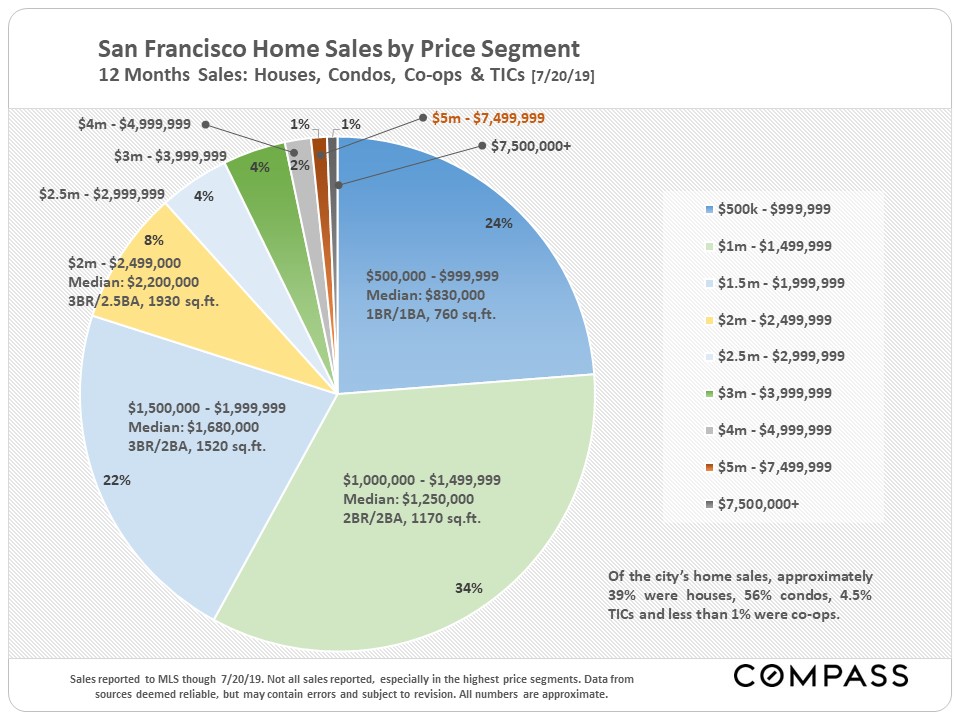
Home Sales by Price Range
Of homes selling for under $1,000,000, over 80% were condos, co-ops and TICs, and most of those were smaller units.
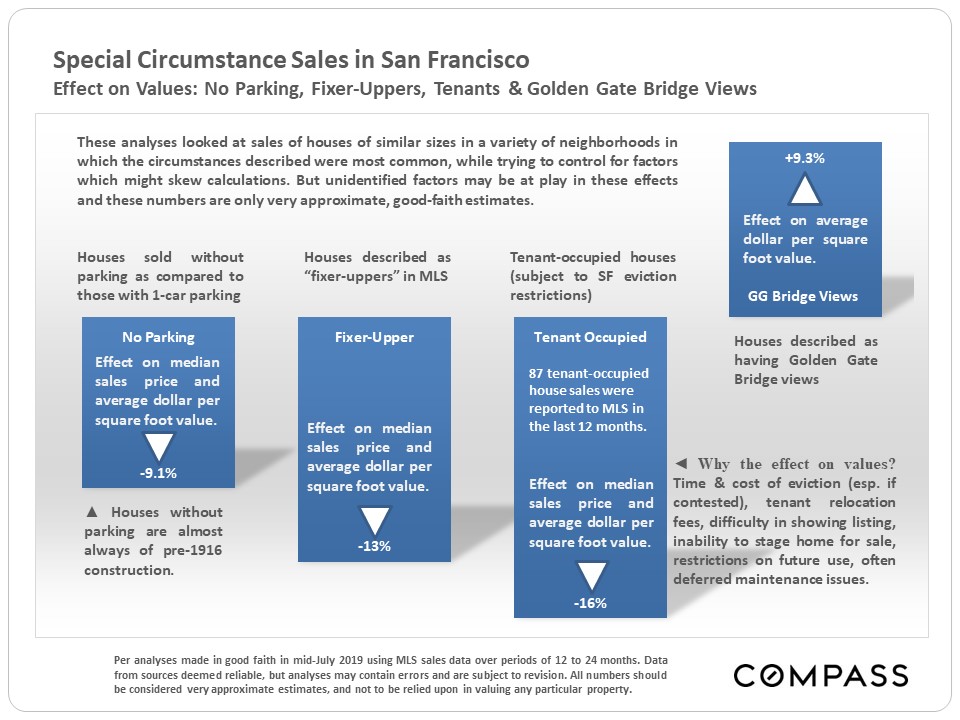
Tenants, Fixer-Uppers, Homes without Parking, Homes with Golden Gate Bridge Views
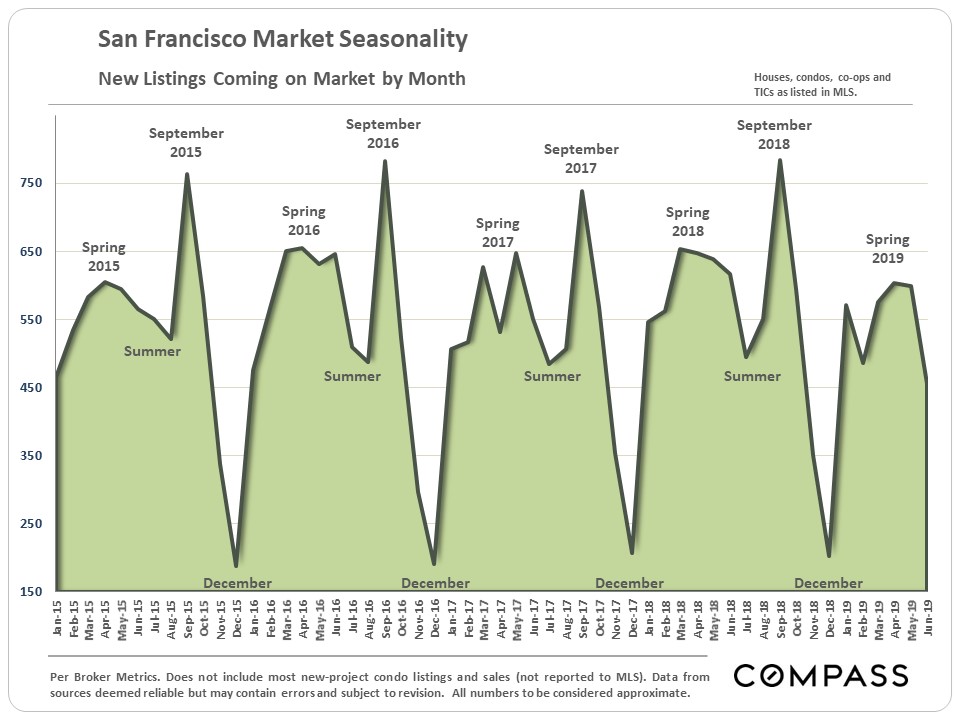
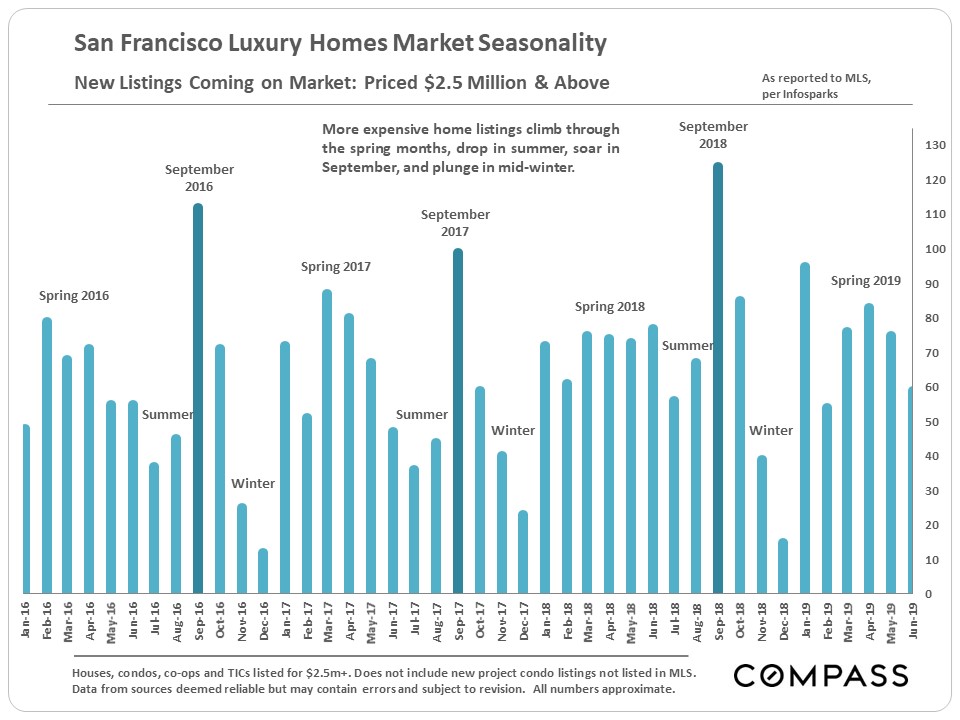
Market Seasonality: The Autumn Spike,
Then the Winter Doldrums
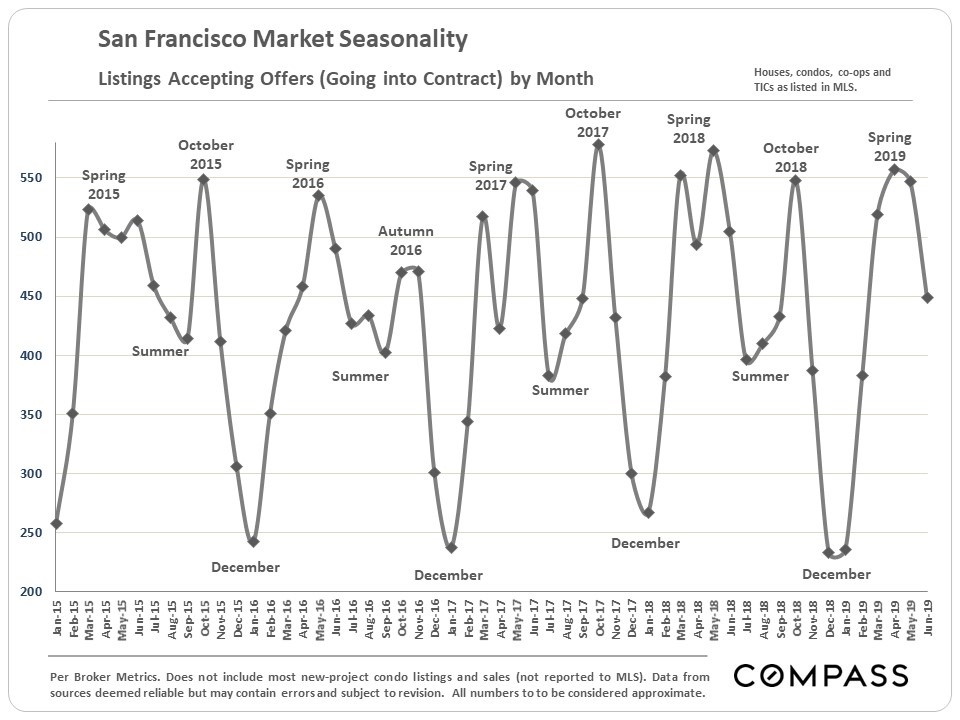
Though spring is the biggest overall selling season in San Francisco, the single month with the highest number of new listings is typically September. This big surge fuels the relatively short autumn selling season – highlighted by the dramatic spike in sales in October. In November, activity begins to plunge for the mid-winter holidays – though homes continue to sell in every season.
Seasonality: New Listings by Month
Seasonality: Listings Going into Contract
by Month
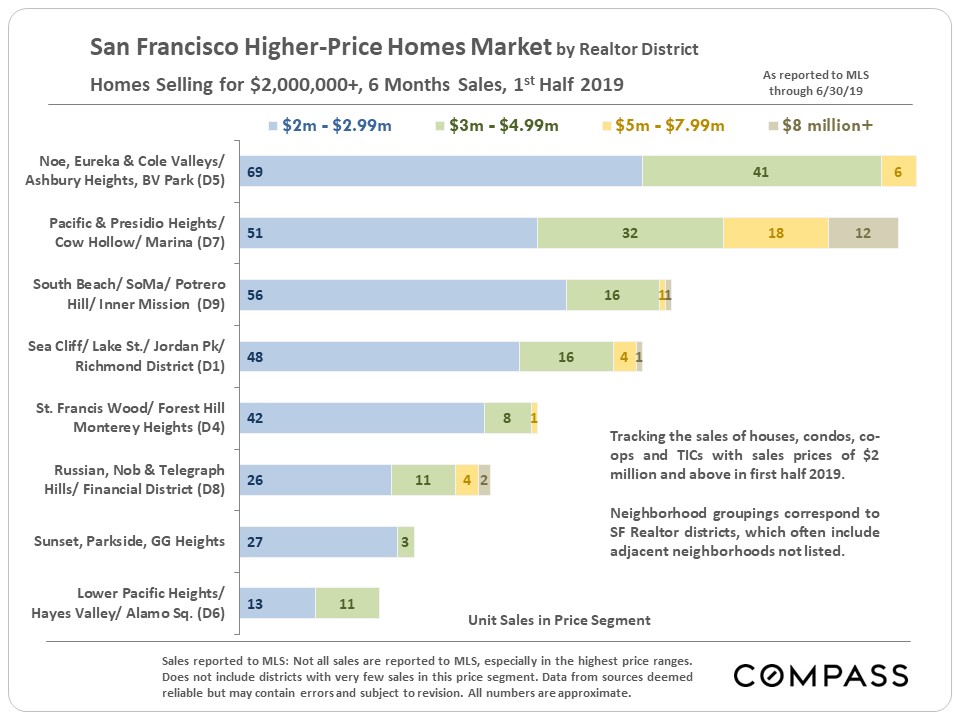
Higher-Price Home Sales
The central greater Noe-Eureka-Cole Valleys district now has the highest number of home sales over $2 million, but the northern Pacific Heights-Cow Hollow district dominates sales of $5 million and above.
The SF luxury home market is even more dramatically driven by seasonality than the general market. September often sees a tremendous burst of new listings. October is sometimes the single month with the most luxury house sales.
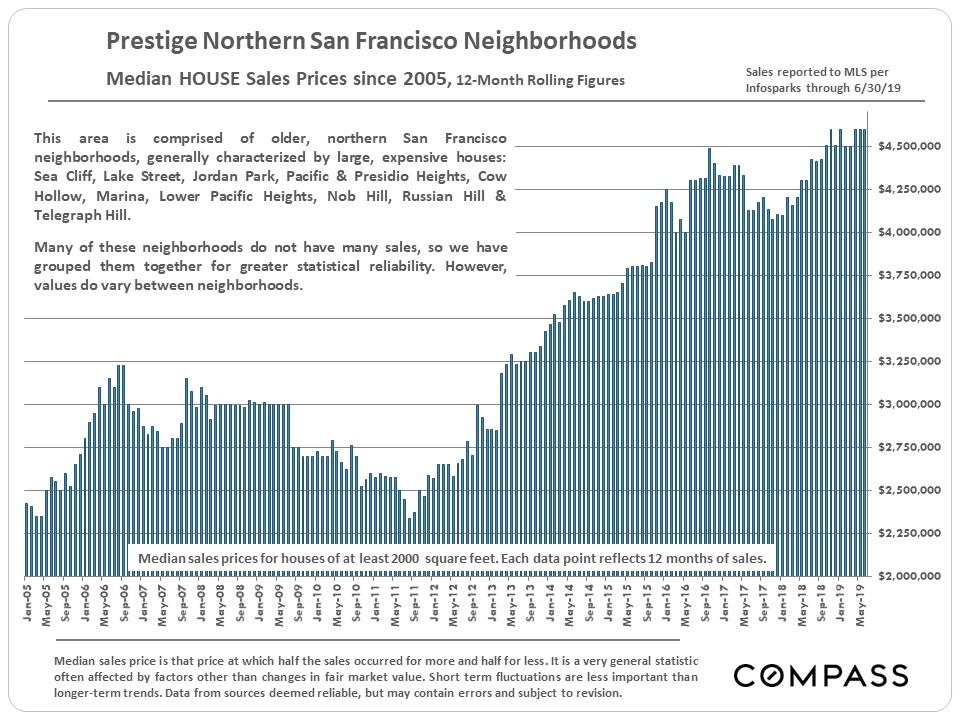
Median Home Price Appreciation in the City’s Northern, Old-Prestige Neighborhoods
In the next chart, we combine house sales across the swathe of older, prestige neighborhoods that run across the north of the city – generally speaking, a region of larger houses and higher prices. None of these neighborhoods have that many sales – and some have very, very few – so we combine them to increase statistical reliability. Though they are all high-price, prices do vary considerably between them.
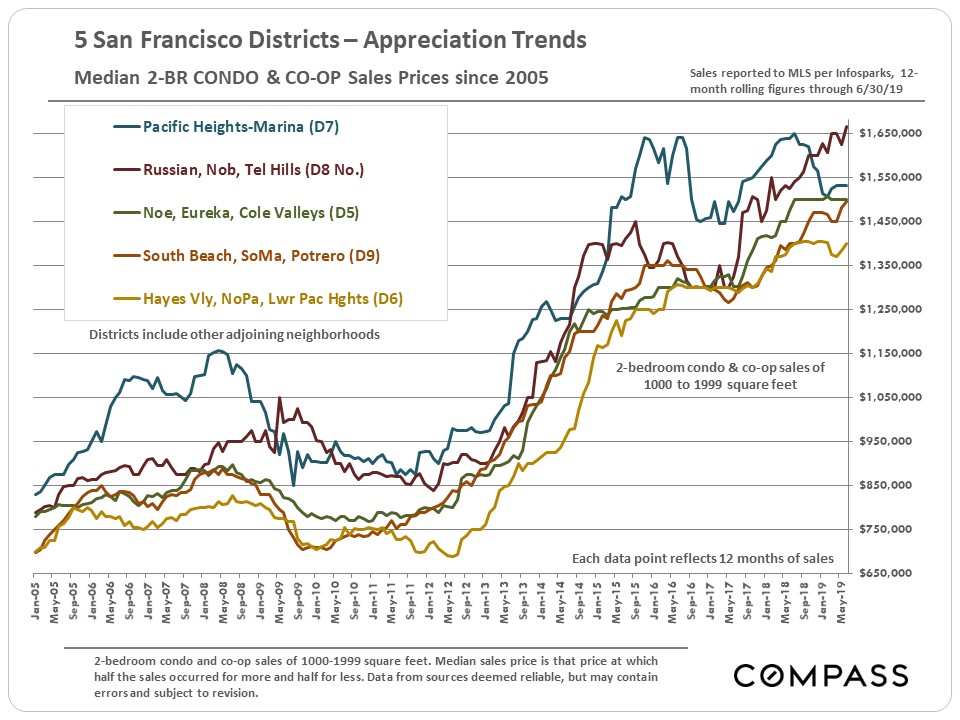
Median Two-Bedroom Condo Prices
by Realtor District
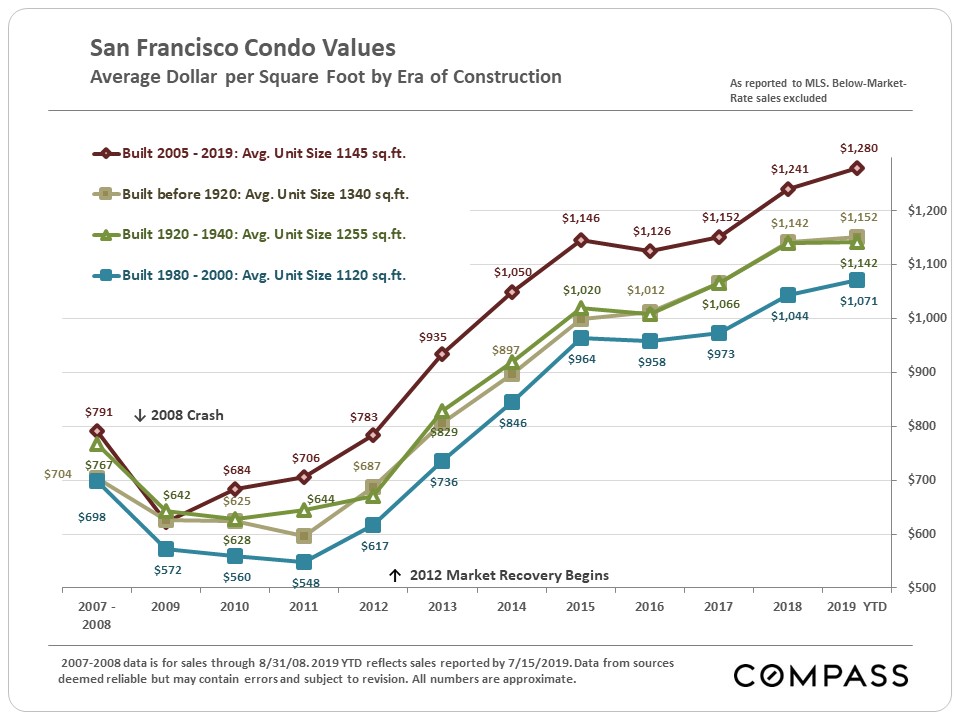
There is significantly less variation in condo prices in most of the neighborhoods of SF than there is with houses. Much of this has to do with all the new construction that has occurred in the last 20 years. Probably the greatest differences in condo values are between those on lower floors and those on higher floors of new luxury high-rises.
Condo Average Dollar per Square Foot Values by Era of Construction
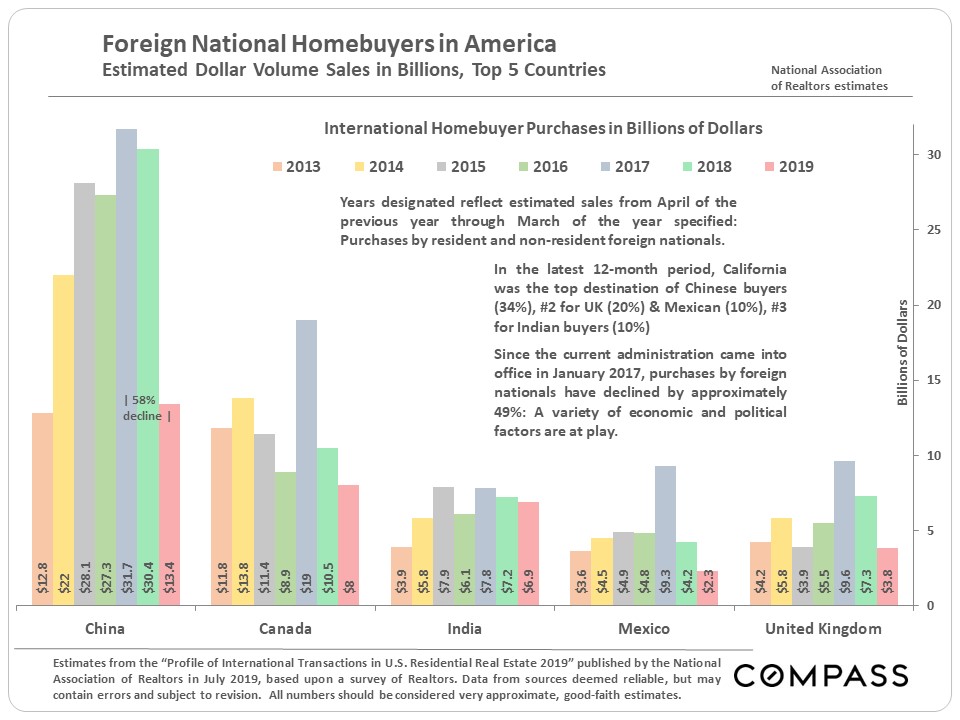
Foreign National Home Buying Tumbles
According to a new report by the National Association of Realtors – based on a survey of its member agents – the purchase of U.S. homes by foreign nationals plunged in the 12 months through March 2019. The drop was particularly steep for Chinese nationals, for whom California (and the Bay Area, in particular) has been the top destination.
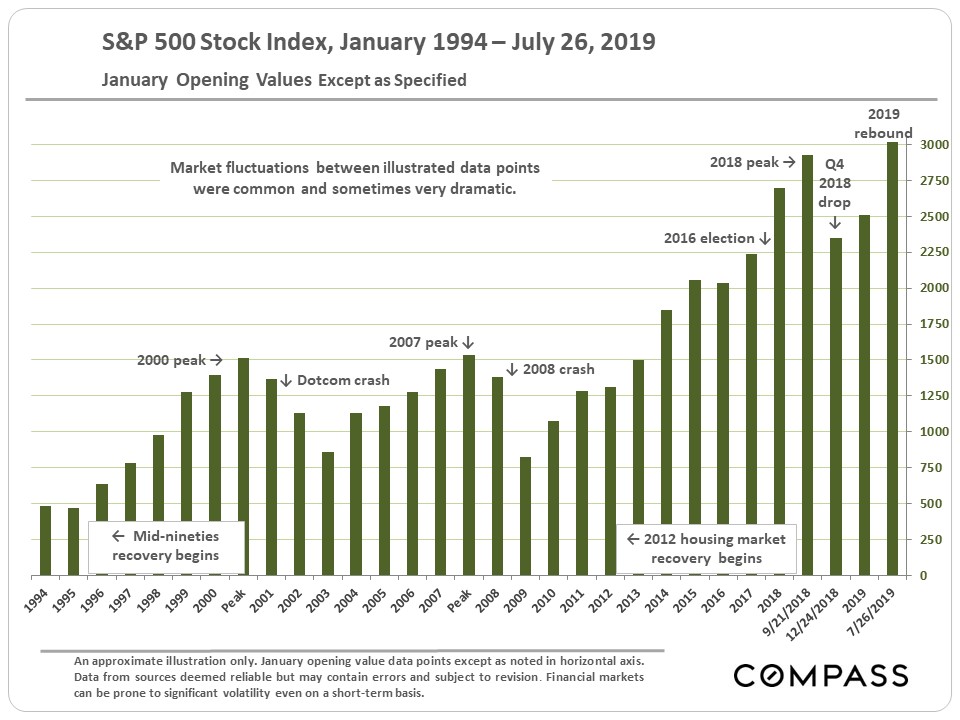
Stock Market Hits New High
The last 12 months have been an extremely dramatic time for financial markets as illustrated below. The alternating confidence and fear generated by its swings have been considerable factors in Bay Area real estate markets. A parallel dynamic has occurred with the swings in interest rates.
The spring burst in high-tech IPOs in San Francisco also played a role in the heat of the Q2 market.

Jeff Salgado
DRE#: 01501886
415.915.9916
jeff(at)jeffsalgado(dotted)com
© Compass 2018 ¦ All Rights Reserved by Compass ¦ Made in NYC
Compass is a licensed real estate broker (01991628) in the State of California and abides by Equal Housing Opportunity laws. All material presented herein is intended for informational purposes only. Information is compiled from sources deemed reliable but is subject to errors, omissions, changes in price, condition, sale, or withdraw without notice. No statement is made as to accuracy of any description. All measurements and square footages are approximate. Exact dimensions can be obtained by retaining the services of an architect or engineer. This is not intended to solicit property already listed