

San Francisco Real Estate
Market Report
August 2020
As illustrated below, the San Francisco market currently reflects a variety of both positive and negative indicators. Among Bay Area markets, the city is seeing the softest recovery from the initial shelter-in-place plunge in activity in early spring, while some other counties – less expensive, more suburban or rural – are experiencing extremely high demand. (See table near the end of this report.)
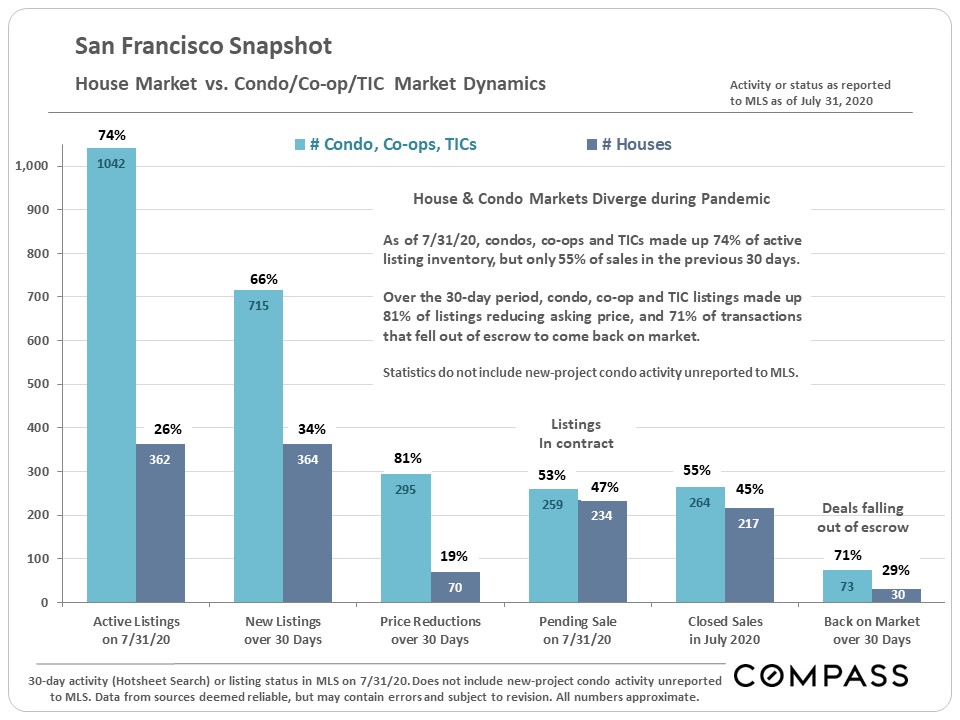
Within San Francisco itself, supply and demand conditions have diverged dramatically between house and condo markets, with the latter being far weaker and rapidly climbing into “buyer’s market” territory.
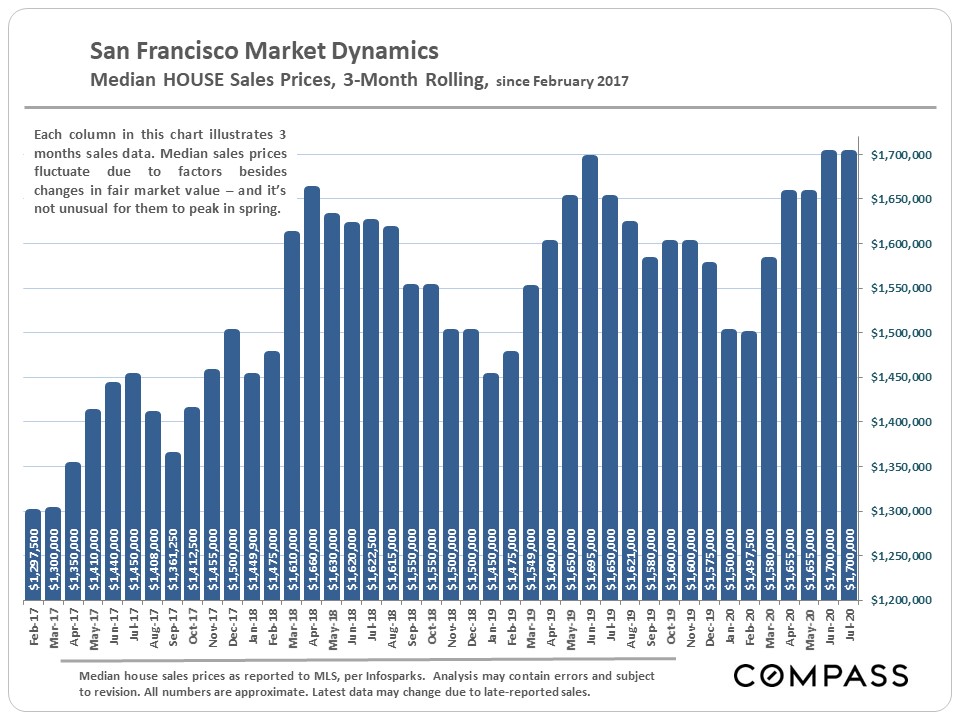
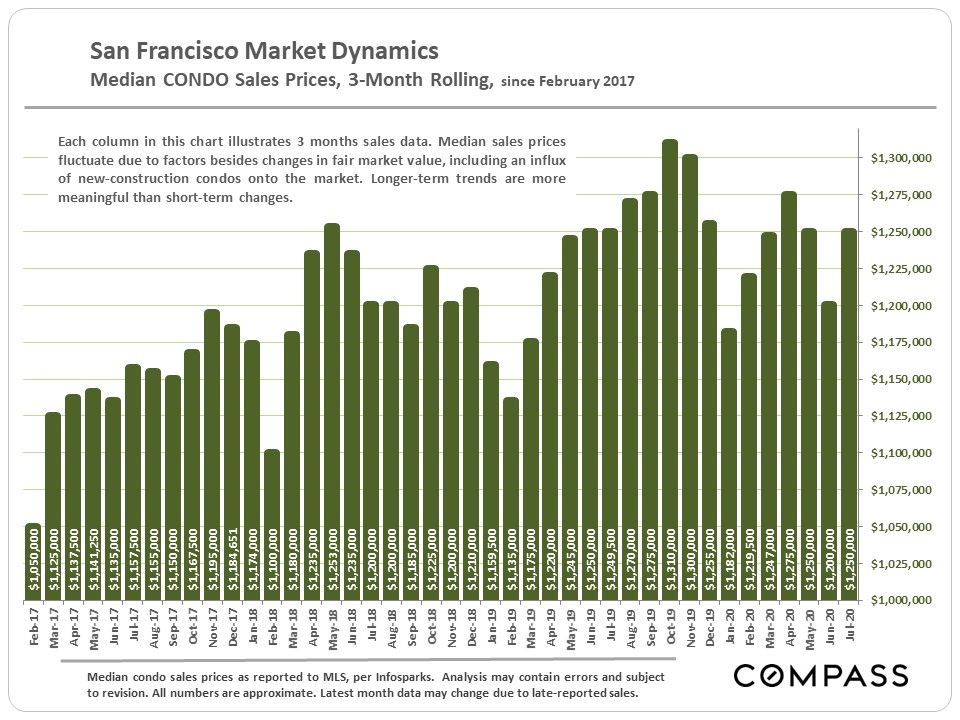
Median Home Sales Prices
On a 3-month rolling basis, SF median house sales prices are as high as they’ve ever been. The median condo sales price, while not particularly low, has been running lower than the highs of last year.
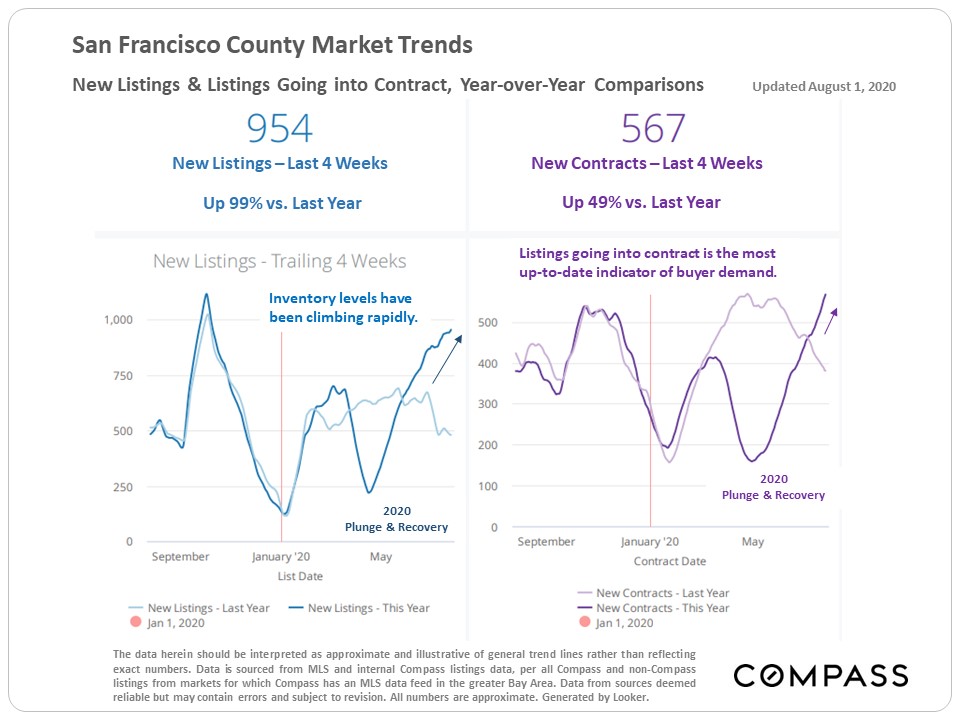
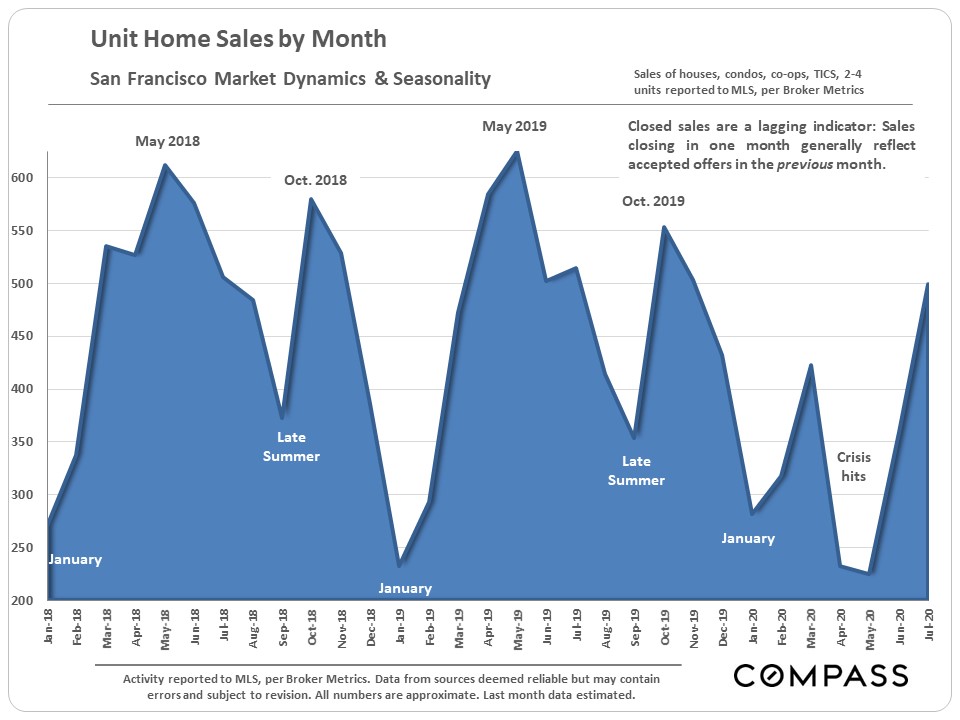
Supply & Demand Indicators
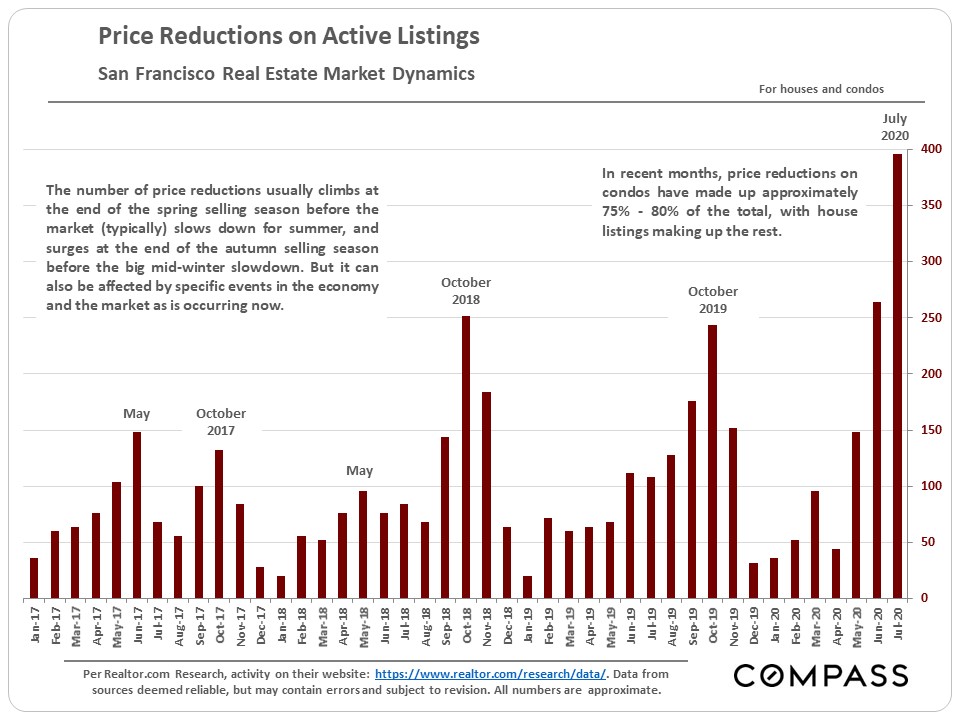
The number of listings going into contract has been increasing, but at a much lower rate than inventory is growing (chart 1). Sales volume is climbing, but is still far below the high points of recent years (chart 2). Price reductions have been soaring in recent months (chart 3).
Diverging House and Condo Market Conditions
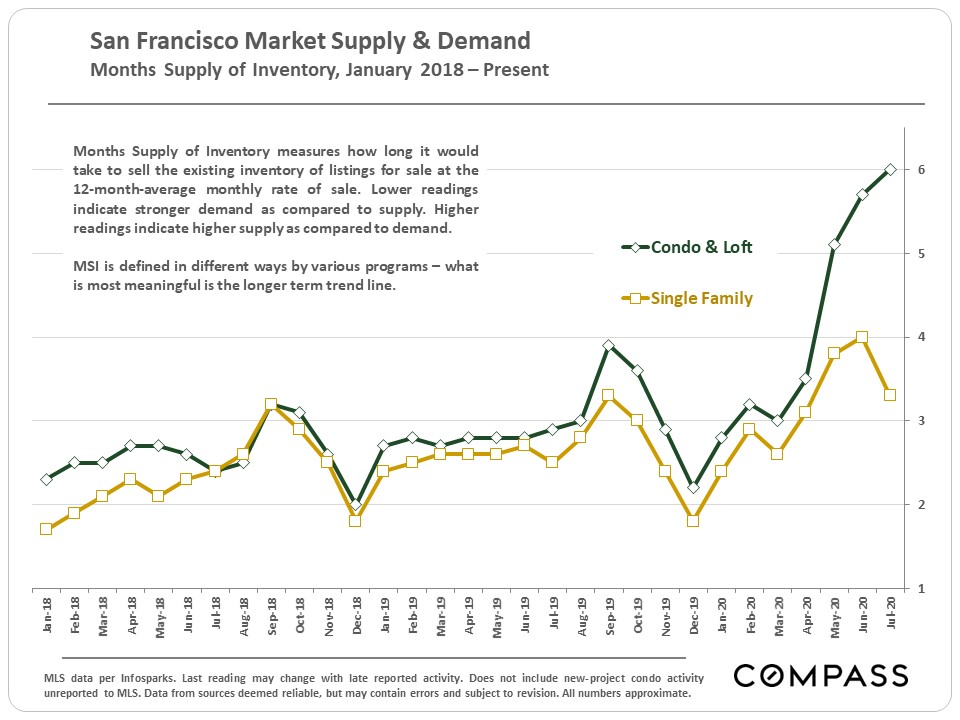
The next 5 charts illustrate the increasingly stark divide in the levels of inventory and buyer demand between these 2 major market segments. However, it should be noted that within the condo market, certain segments and locations are performing better than others. The largest condo market in San Francisco – the greater South Beach, SoMa, Mission Bay, Civic Center area, dominated by large complexes and high-rise buildings, including continuing new construction projects – is seeing the weakest conditions.
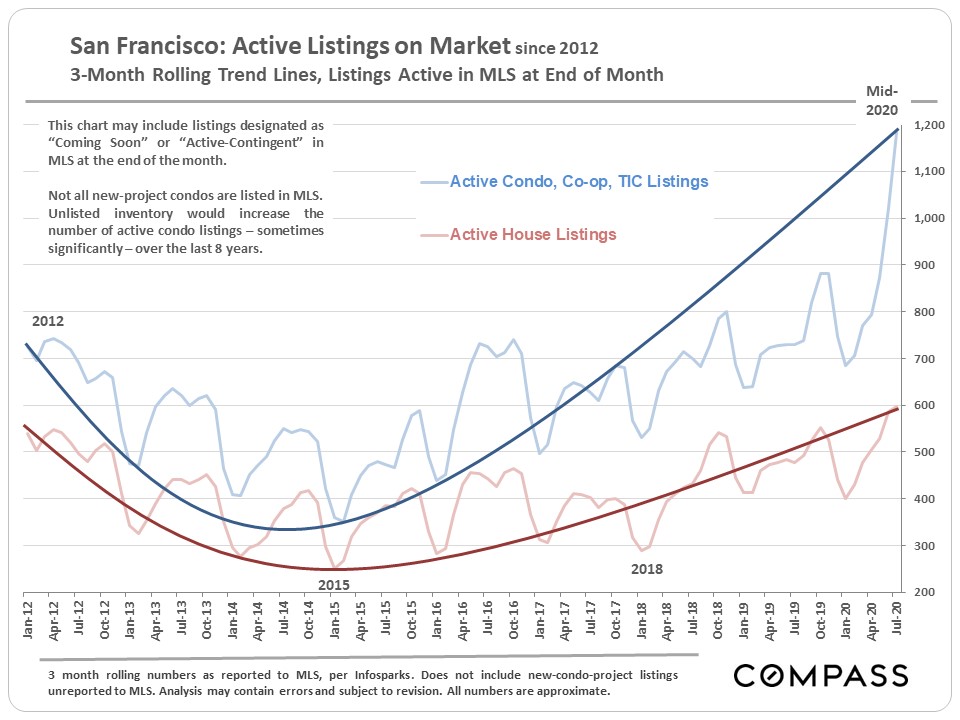
As illustrated in the following 2 graphs, the supply of listings on the market is at its highest point in 8 years, with the inventory of condos spiking way, way up. As a market softens, correct pricing becomes increasingly critical for sellers. In a hot market, buyers compete for listings; in a cooler market, sellers compete for buyers.
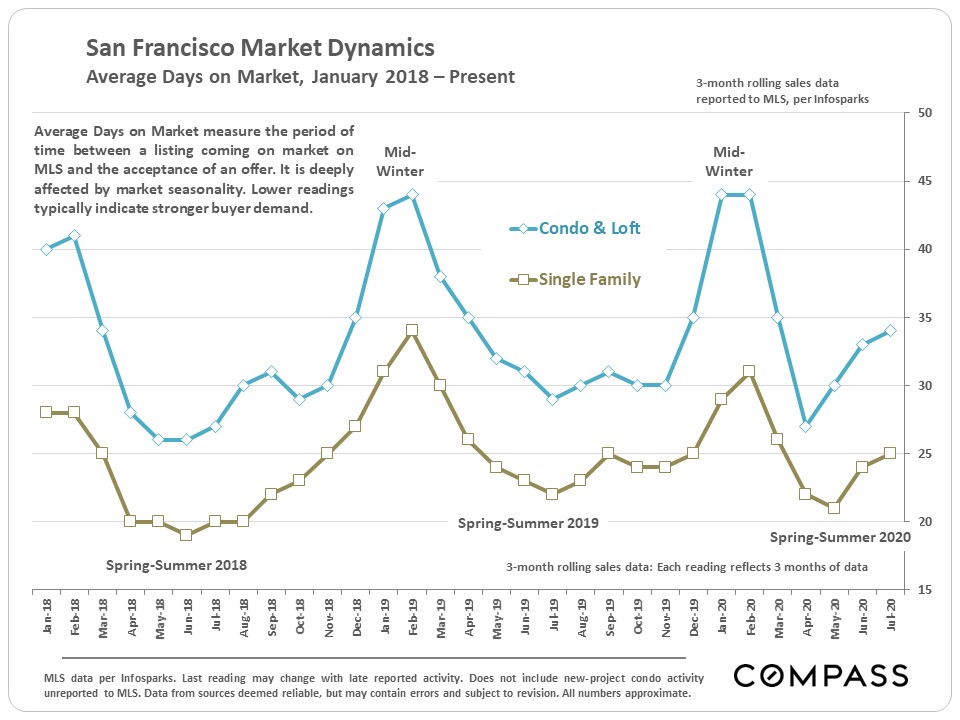
Though climbing in recent months, the days-on-market figures are not high. It appears those listings selling are going into contract relatively quickly.
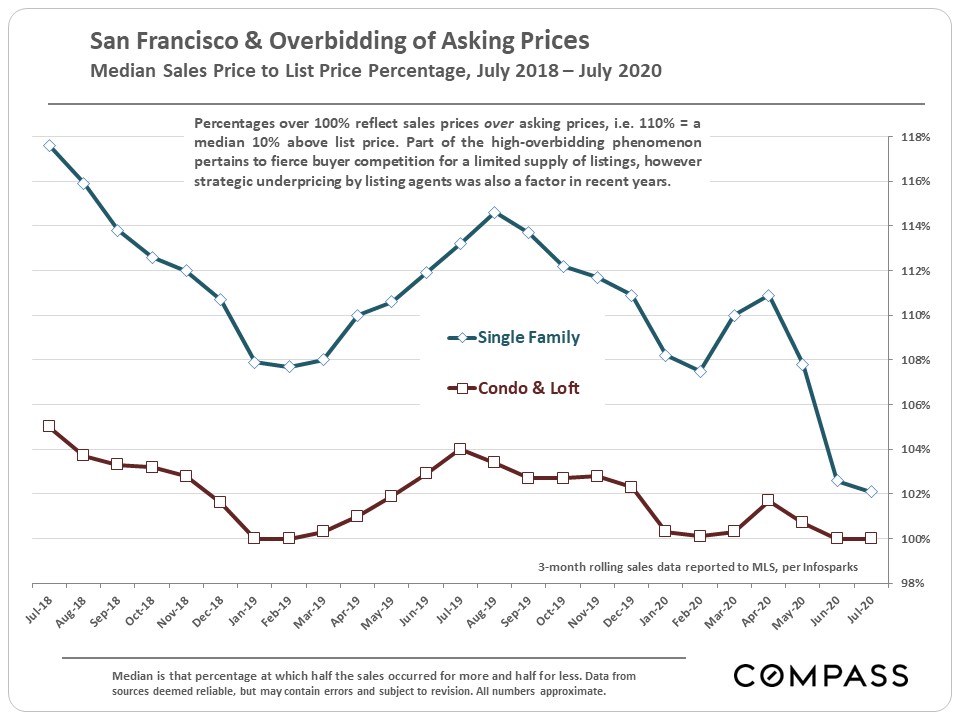
The amount and magnitude of buyers overbidding asking prices is considerably diminished from levels seen in the past 6 years. Part of this is due to the change in showing conditions brought about by strict shelter-in-place rules. But in an environment of increased inventory, buyers see a reduced necessity to compete with each other.
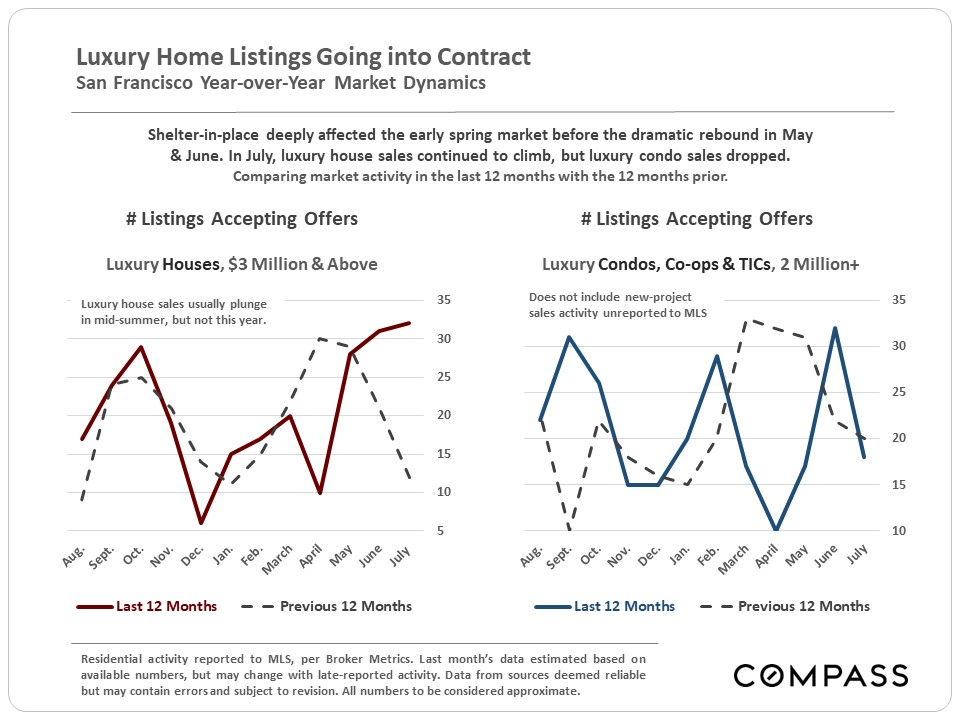
Luxury Homes Going into Contract
Comparative Conditions around the Bay Area
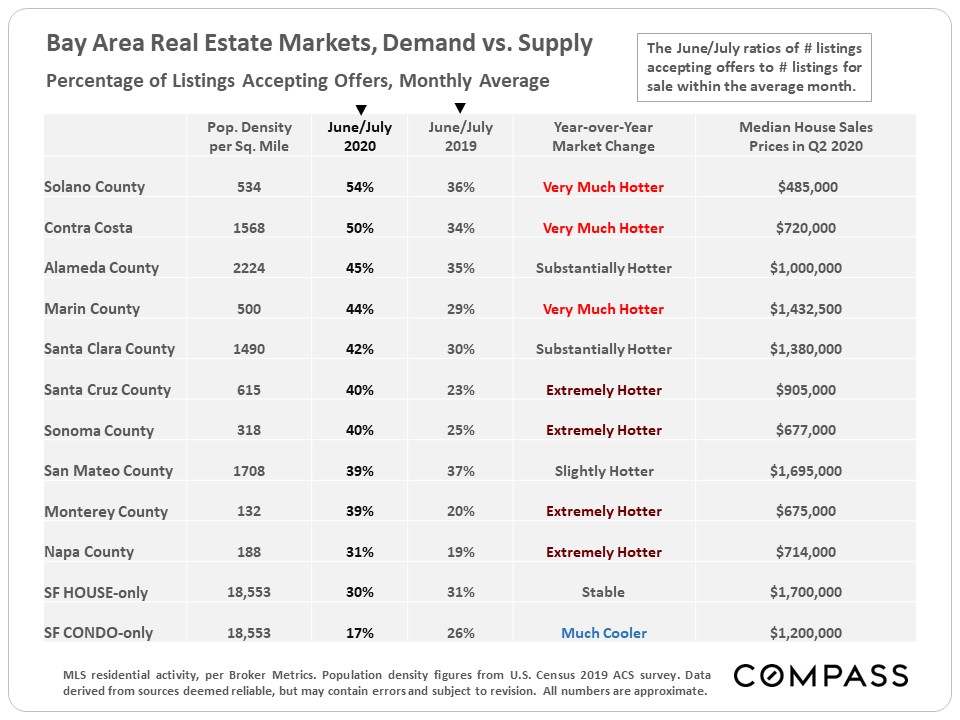
This table ranks each county by the percentage of active listings going into contract in June/July 2020 – a standard statistic of market heat – compares it to the same period of last year, and then rates the year-over-year change. Many counties are seeing hugely increased demand over last year. The SF house market is about the same as last year, and the SF condo market is substantially cooler.
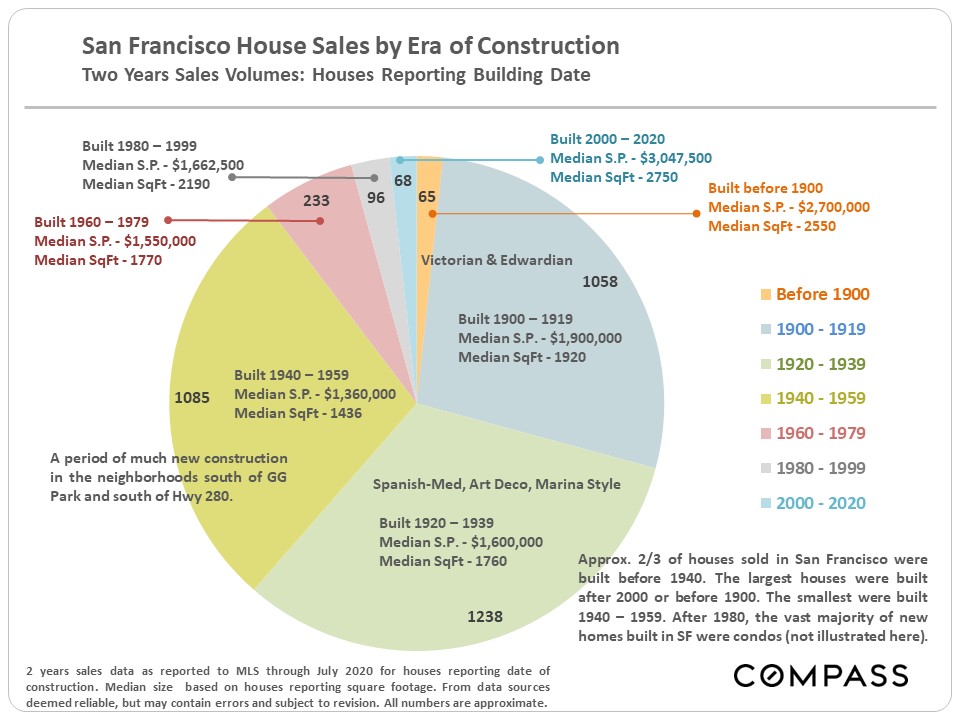
San Francisco Era of Construction
This chart looks at the number of house sales over 2 years in different periods of construction. SF is a city of older houses with relatively little new house construction in the past 30 -40 years.
The condo market had similar divisions up until about 1980, when new condo construction blasted off to add tens of thousands of new units to the market, sometimes creating huge new residential neighborhoods.

Jeff Salgado
DRE#: 01501886
415.915.9916
jeff(at)jeffsalgado(dotted)com
© Compass 2020 ¦ All Rights Reserved by Compass ¦ Made in NYC
Compass is a real estate broker licensed by the State of California operating under
multiple entities. License Numbers 01991628, 1527235, 1527365, 1356742, 1443761, 1997075,
1935359, 1961027, 1842987, 1869607, 1866771, 1527205, 1079009, 1272467. All material presented
herein is intended for informational purposes only and is compiled from sources deemed reliable
but has not been verified. Changes in price, condition, sale or withdrawal may be made without
notice. No statement is made as to accuracy of any description. All measurements and square
footage are approximate. Equal Housing Opportunity.