
![]()

Bay Area Real Estate
Markets Survey
A Compass Special Report
December 2018
Angles on Appreciation
& Comparative Values
Declining & Sometimes Negative
Appreciation Rates
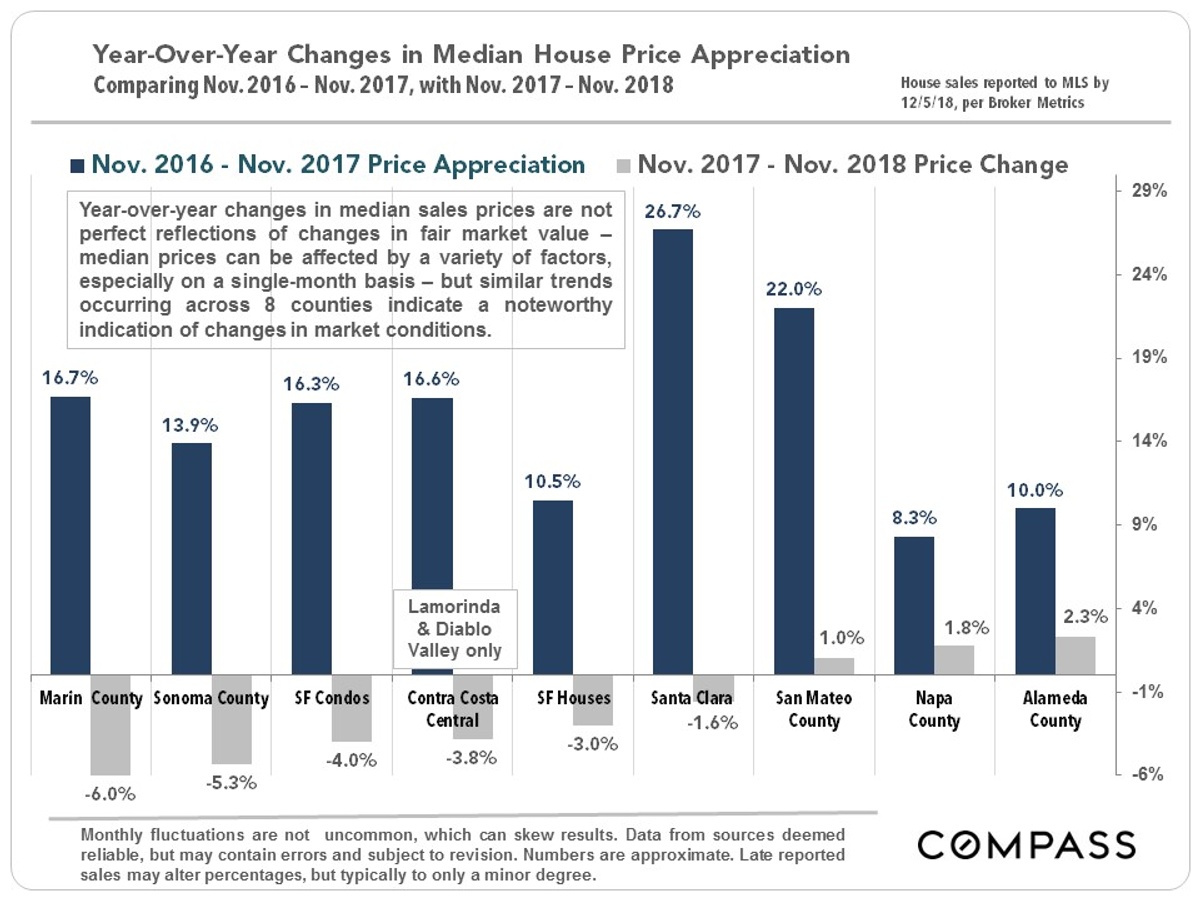
We are always hesitant to make too much of a single month’s or a few months’ data: Short-term fluctuations in median sales prices and other market statistics are not uncommon and don’t always give definitive perspective as to where the market is heading on a longer-term basis. Still, many of the changes seen over recent months are substantial – and none more so than the sudden plunge in year-over-year median price appreciation rates illustrated below: a number of counties plummeted into negative territory in November, and the others saw drastic declines.
Again: It is important not to make too much of short-term data. Indicators can also be somewhat schizophrenic at the beginning of a significant market transition – if that is what is occurring – as buyers, sellers and agents struggle to figure out a changing reality.
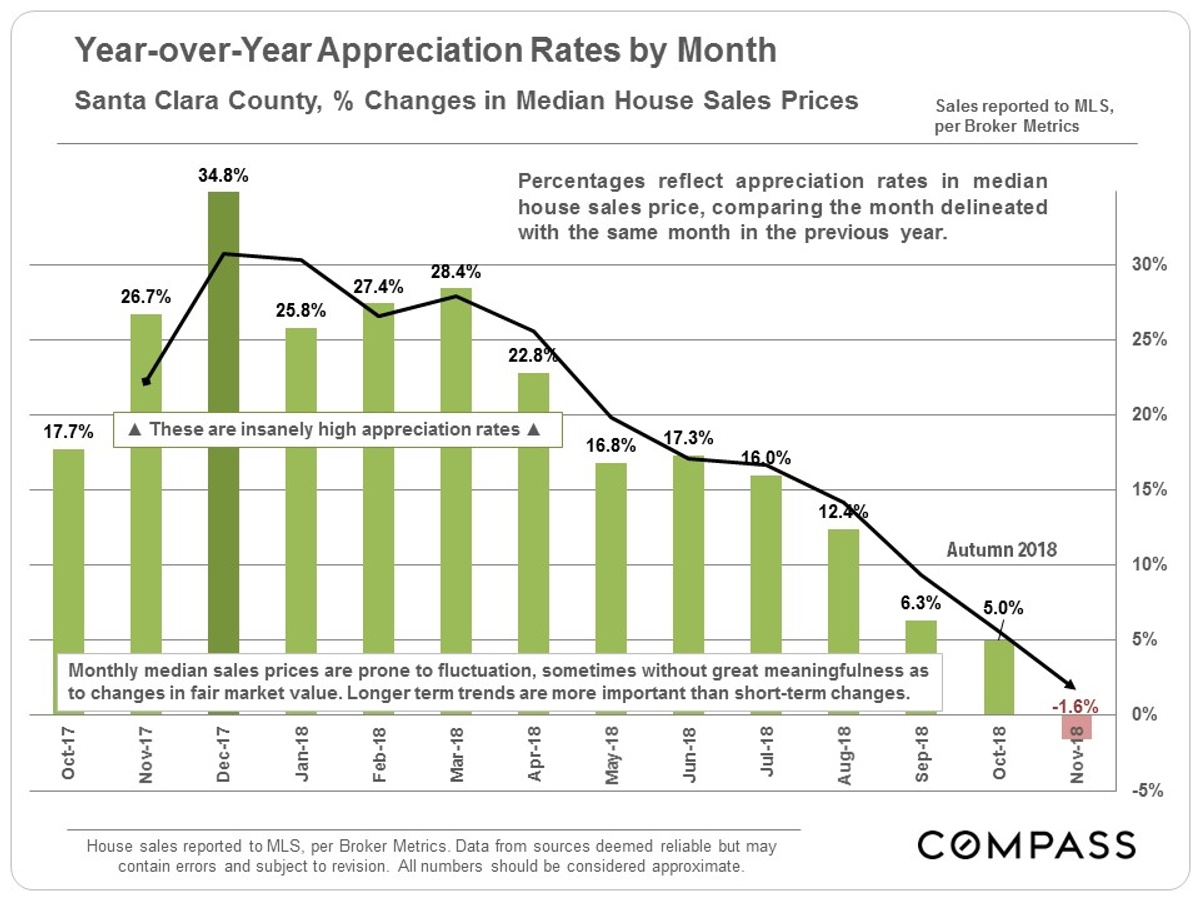
As a sample of a month by month progression over the past year: Santa Clara County may have been the hottest market in the country in 2017 through early spring 2018. Then it started cooling off more rapidly and more definitively than most other Bay Area markets. This shows up in a number of statistics, including declining year-over-year appreciation rates, as illustrated below.
Q3 2018 Median House Sales Prices
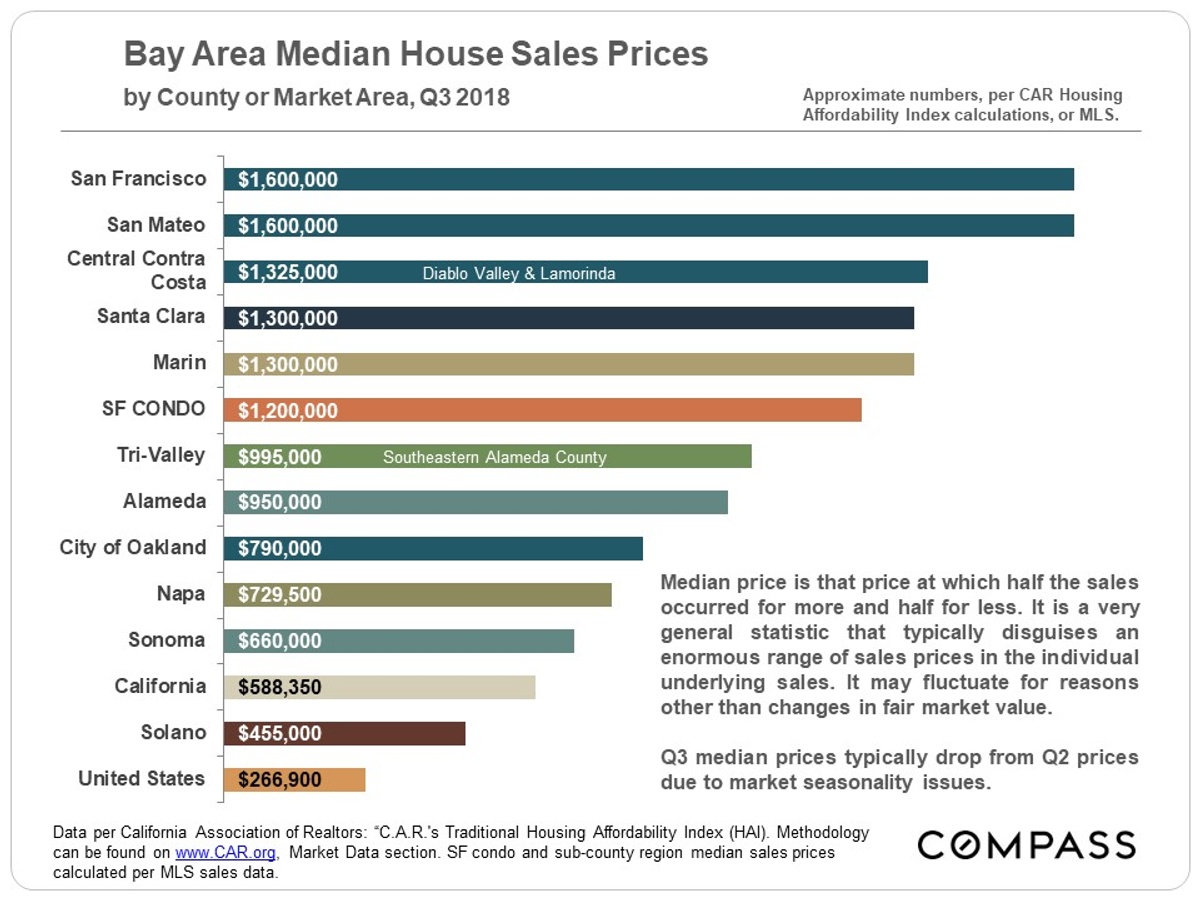
What the Median Price Buys by Bay Area County
Bay Area median home prices vary enormously, and so does what one actually gets for those median prices: From a 3-BR, 2-BA, 1418 square foot home in Oakland to a 4-BR, 3-BA, 2460 square foot home in Lamorinda and Diablo Valley (in Central Contra Costa). Comparing median sales prices is not an apples-to-apple calculation of value.

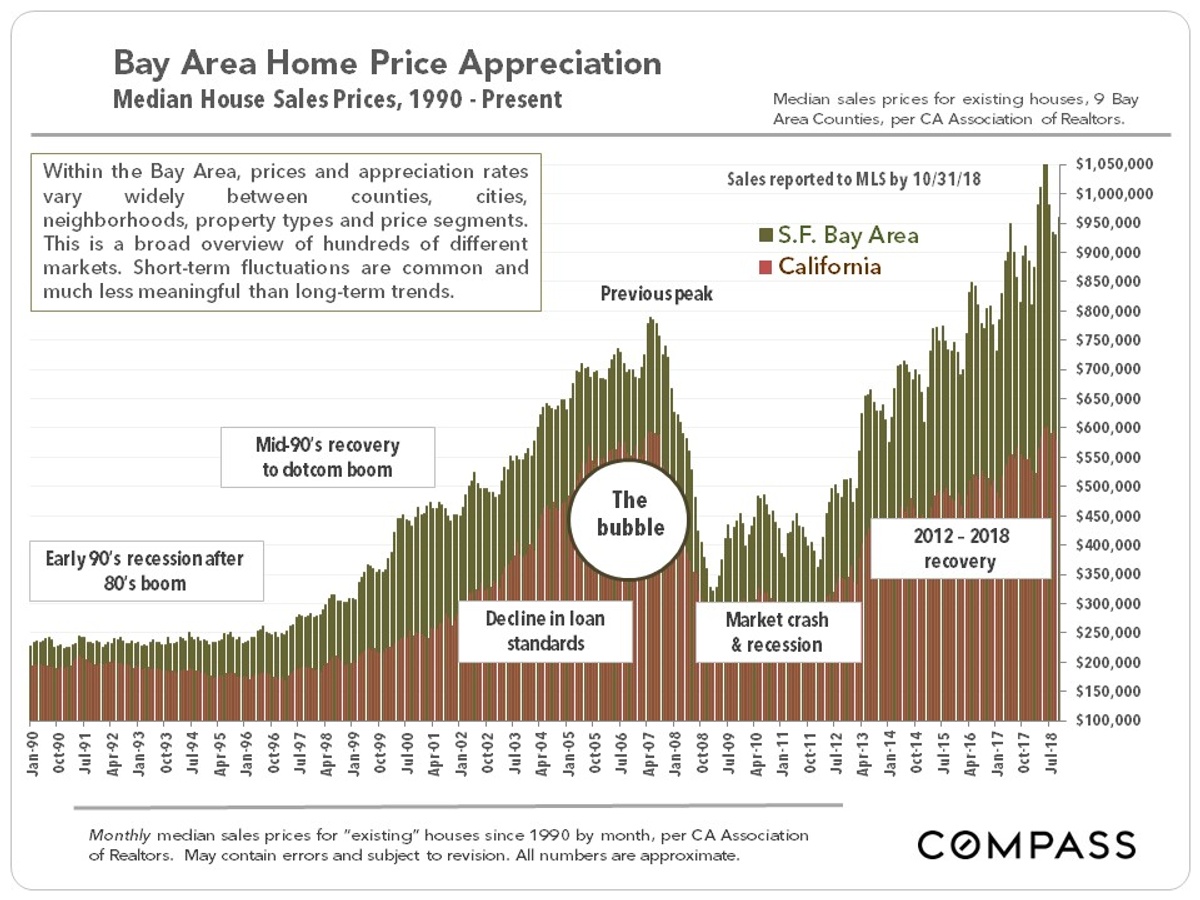
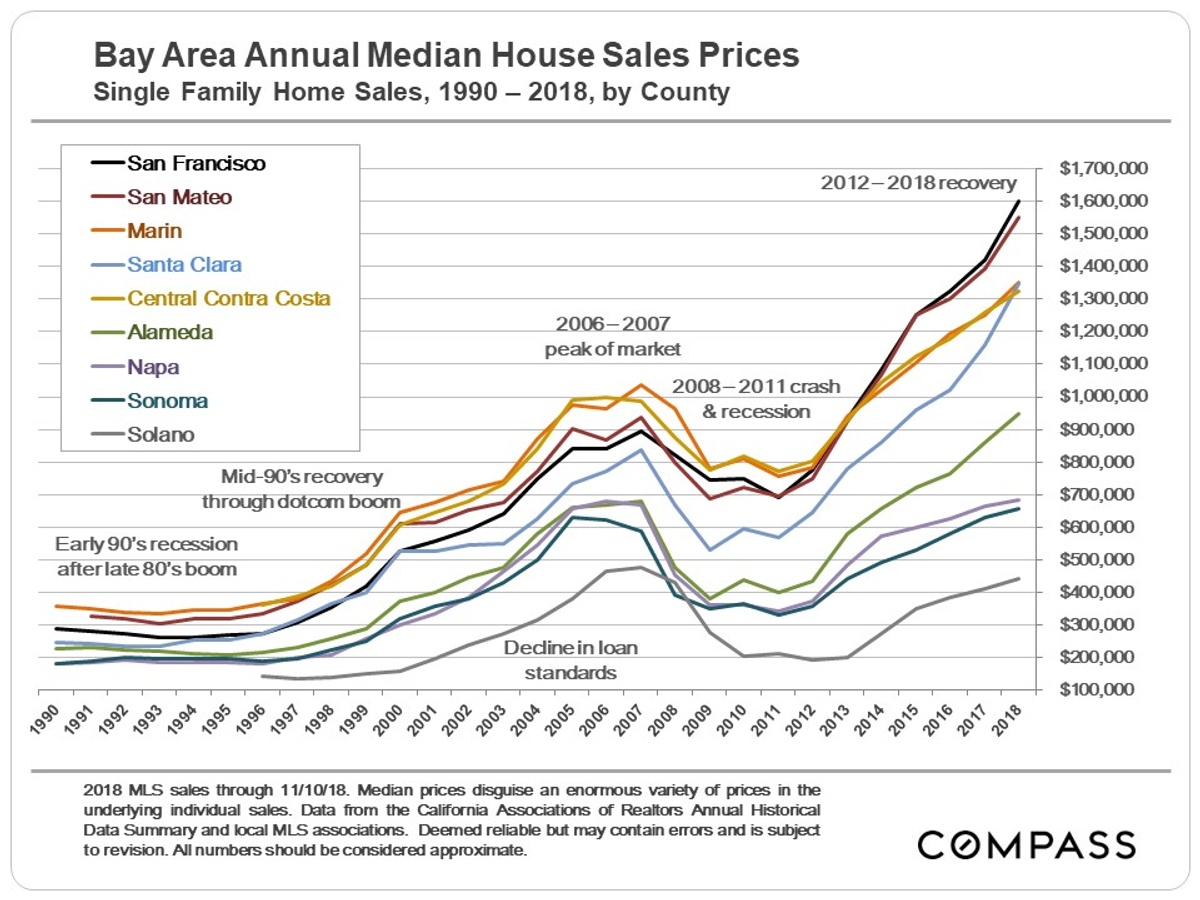
Bay Area & CA Appreciation since 1990
Bay Area Annual Appreciation 1990 by County
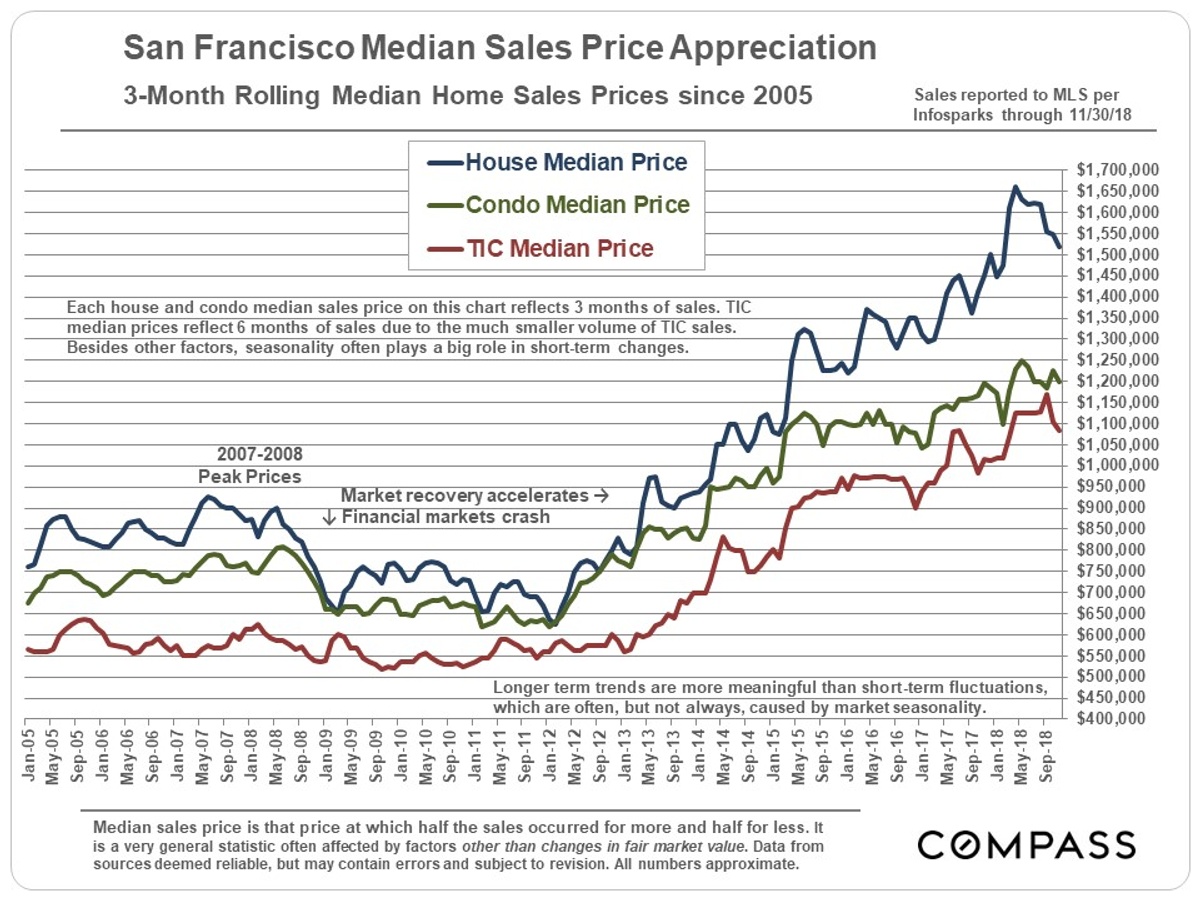
San Francisco Home Price Appreciation
As a sample of county median price trends, below is a chart illustrating 3-month-rolling median price movements in SF itself – 3-month rolling data doesn’t fluctuate as wildly as monthly prices sometimes do, though there are clear seasonal changes. It’s not unusual for median sales prices to drop from springtime highs, but the drop this year in the median house price (the top blue line) has been somewhat longer and deeper than is usually the case: By November, it was $145,000 below the peak hit in April 2018.
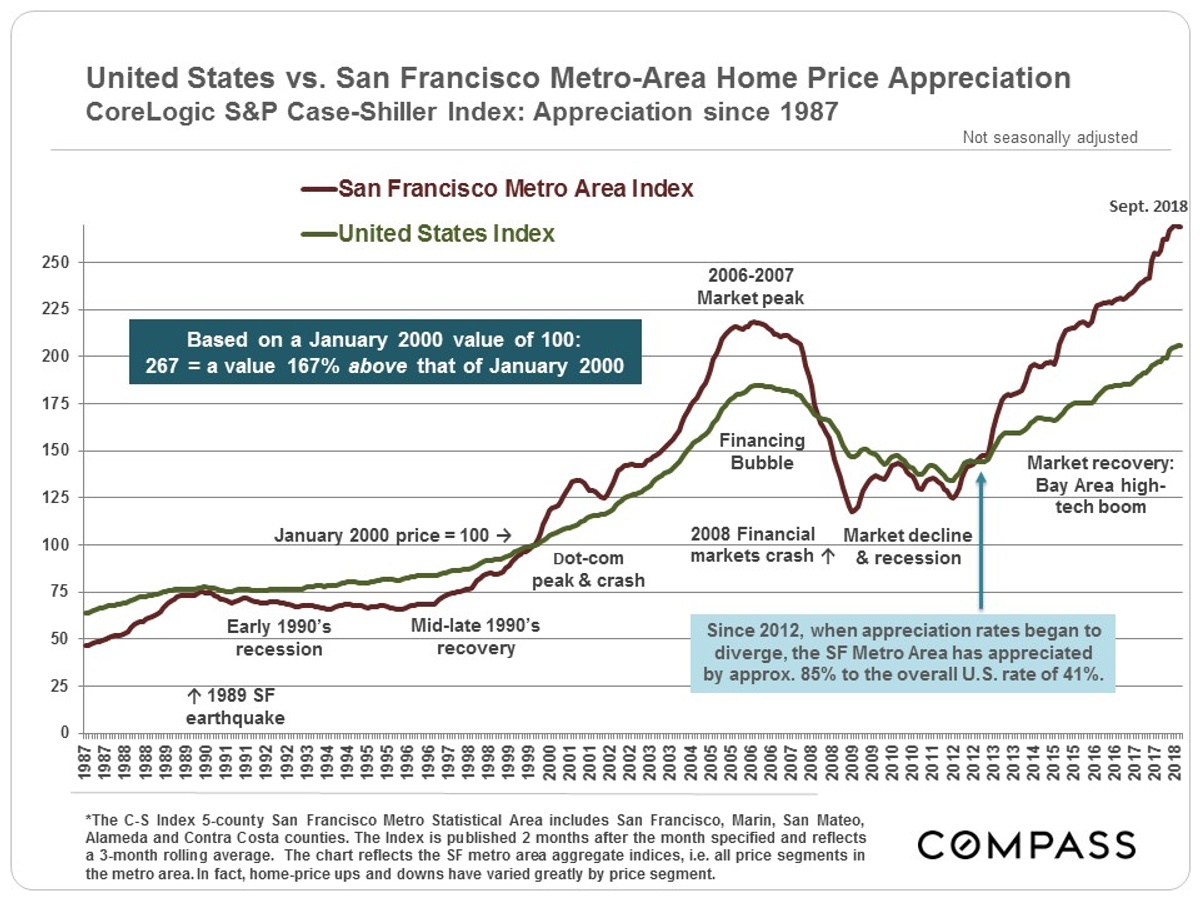
Bay Area vs. U.S. Appreciation since 1987
The below chart based on S&P CoreLogic Case-Shiller data – which uses its own algorithm to measure home price appreciation instead of median sales price changes – compares real estate market cycles between the Bay Area and the United States over the past 30 years.
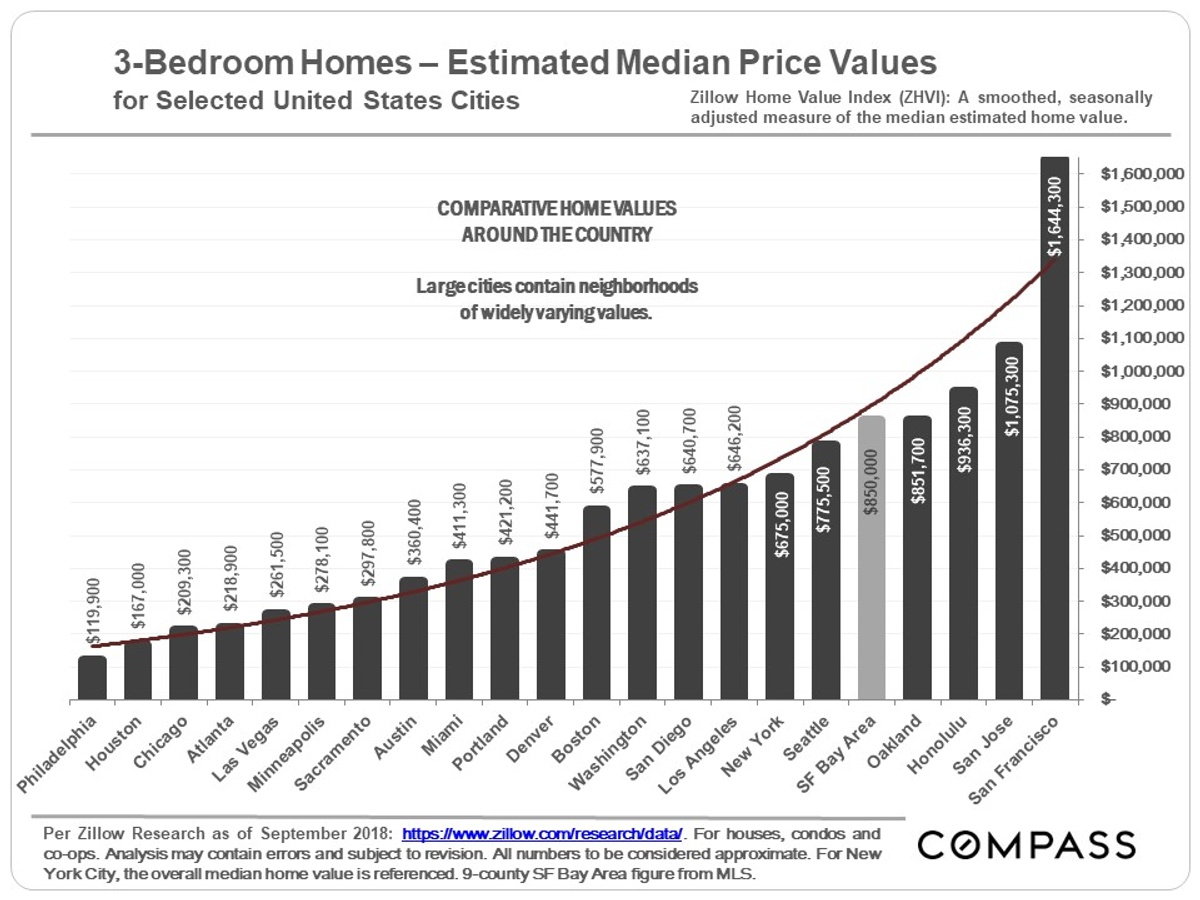
U.S. Comparative Home Values by City
One can buy approximately 14 median-priced 3-bedroom homes in Philadelphia, 10 in Houston, 4 in Miami or Portland, or 2 in Seattle, for the cost of one in San Francisco.
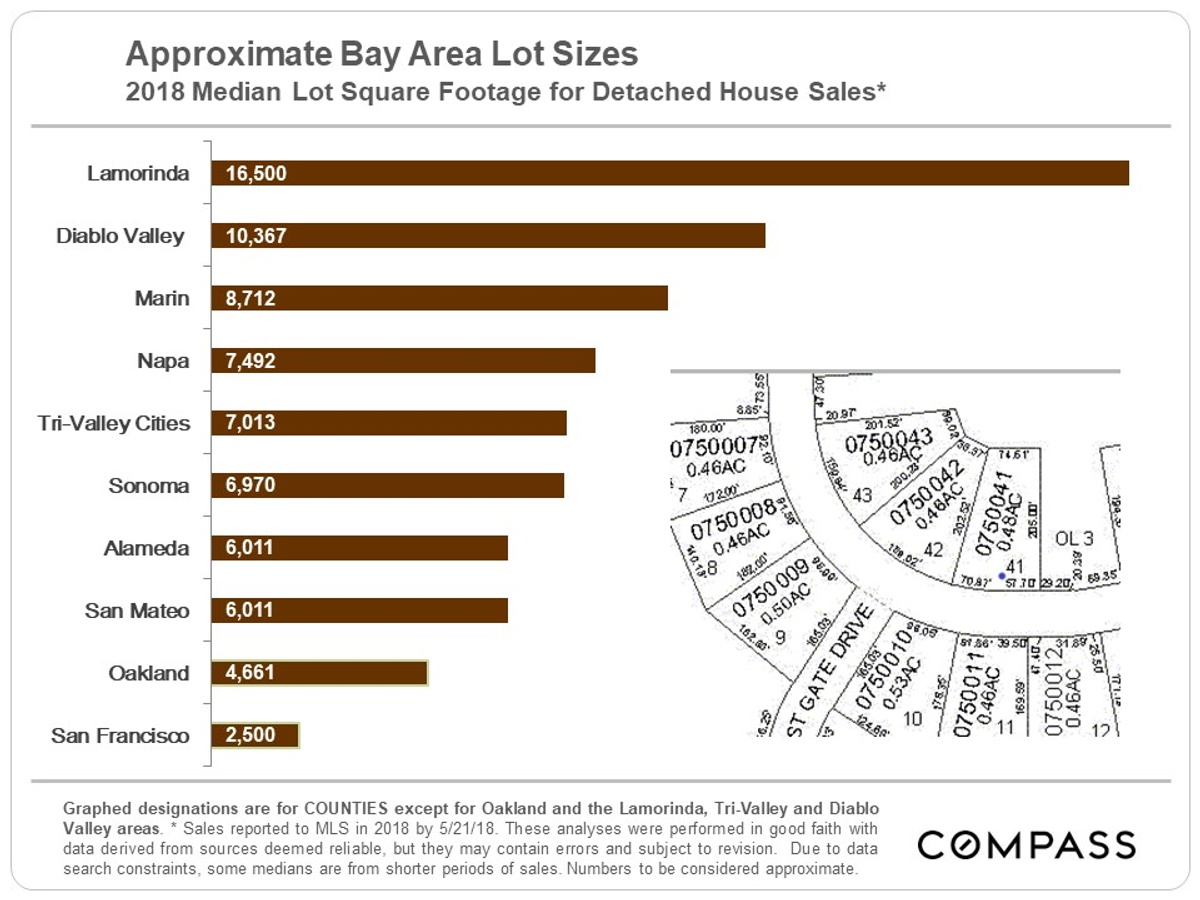
Bay Area Median Lot Sizes
Depending on the county or community, the amount of elbow room around your home – as measured by median lot size – also varies. Even the most expensive homes in San Francisco, costing $20m to $40m, often sit right next to each other. In other counties, at the upper price ranges, one sometimes gets rolling acreage or vineyards.
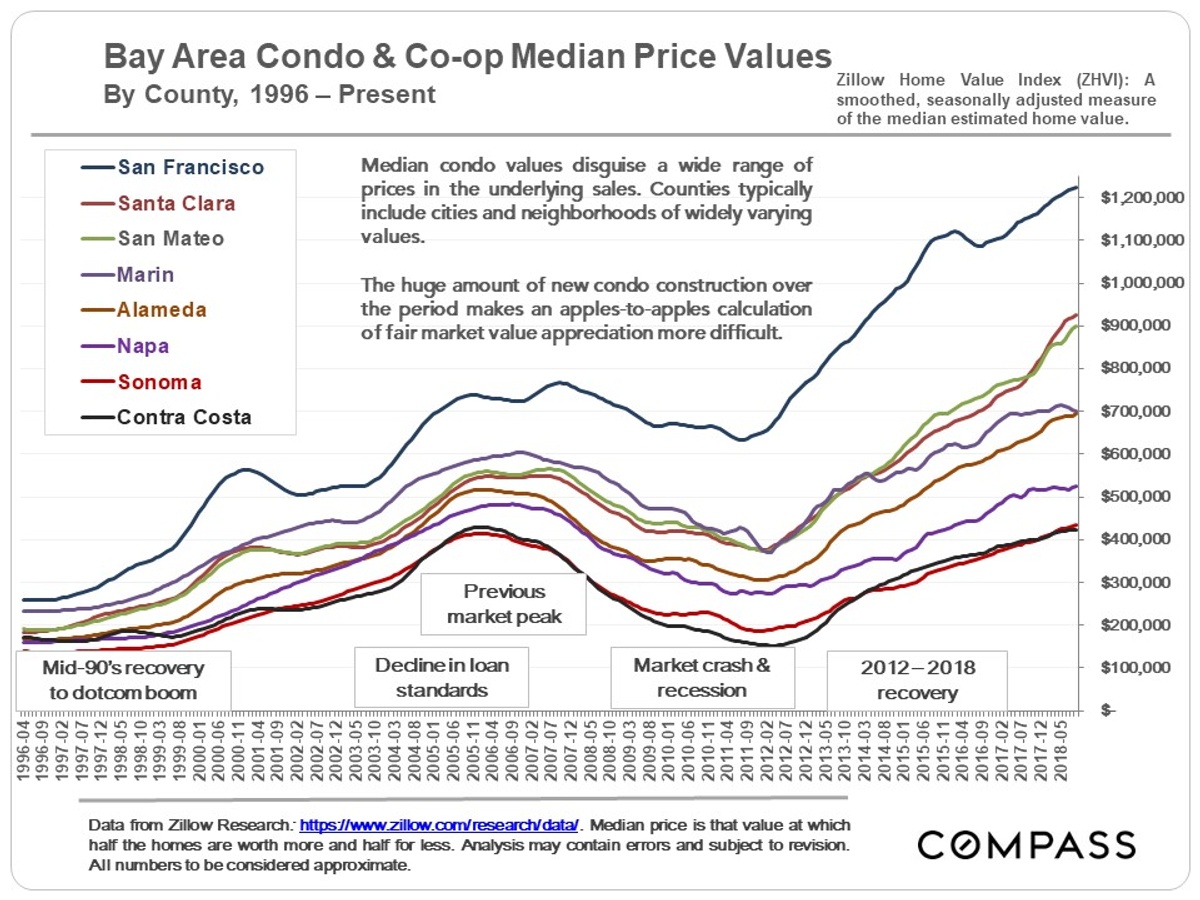
Bay Area Median Condo Prices & Appreciation
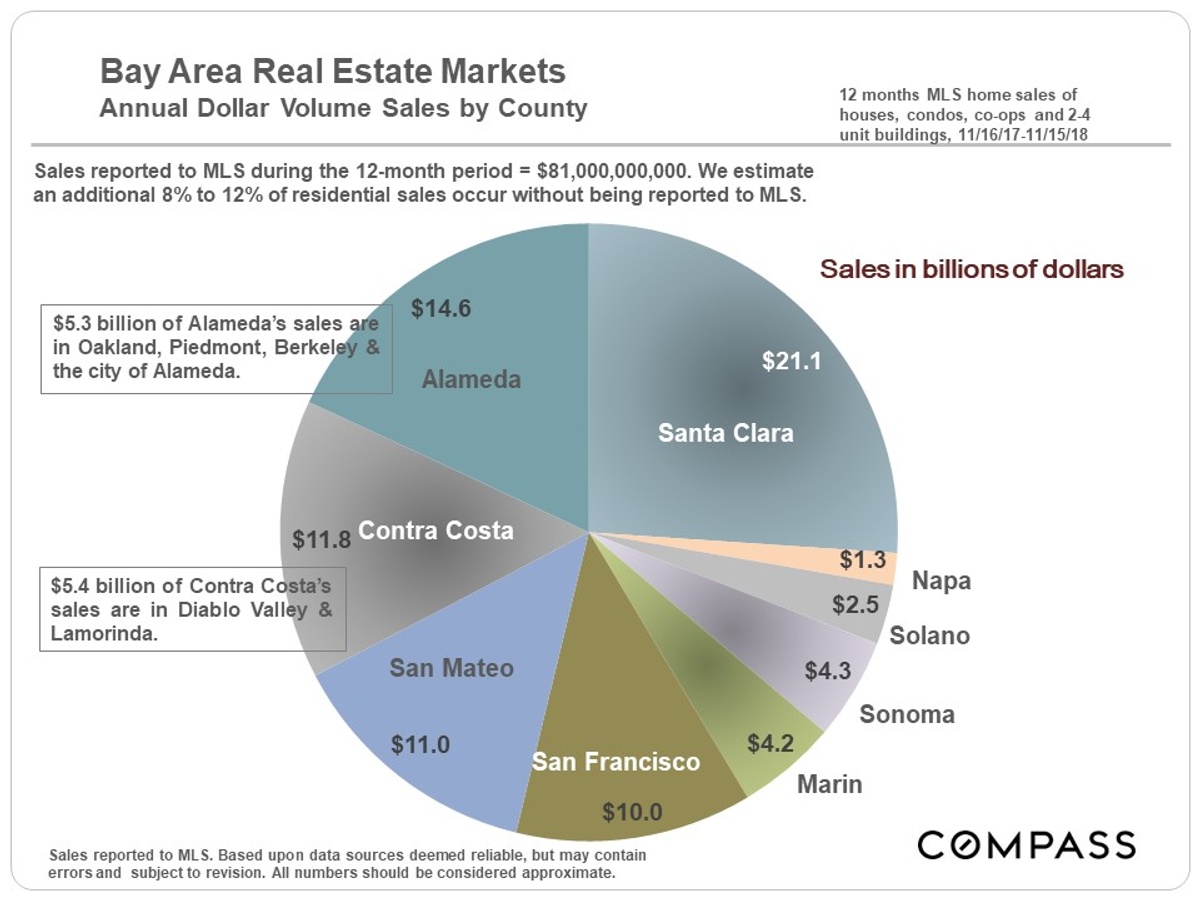
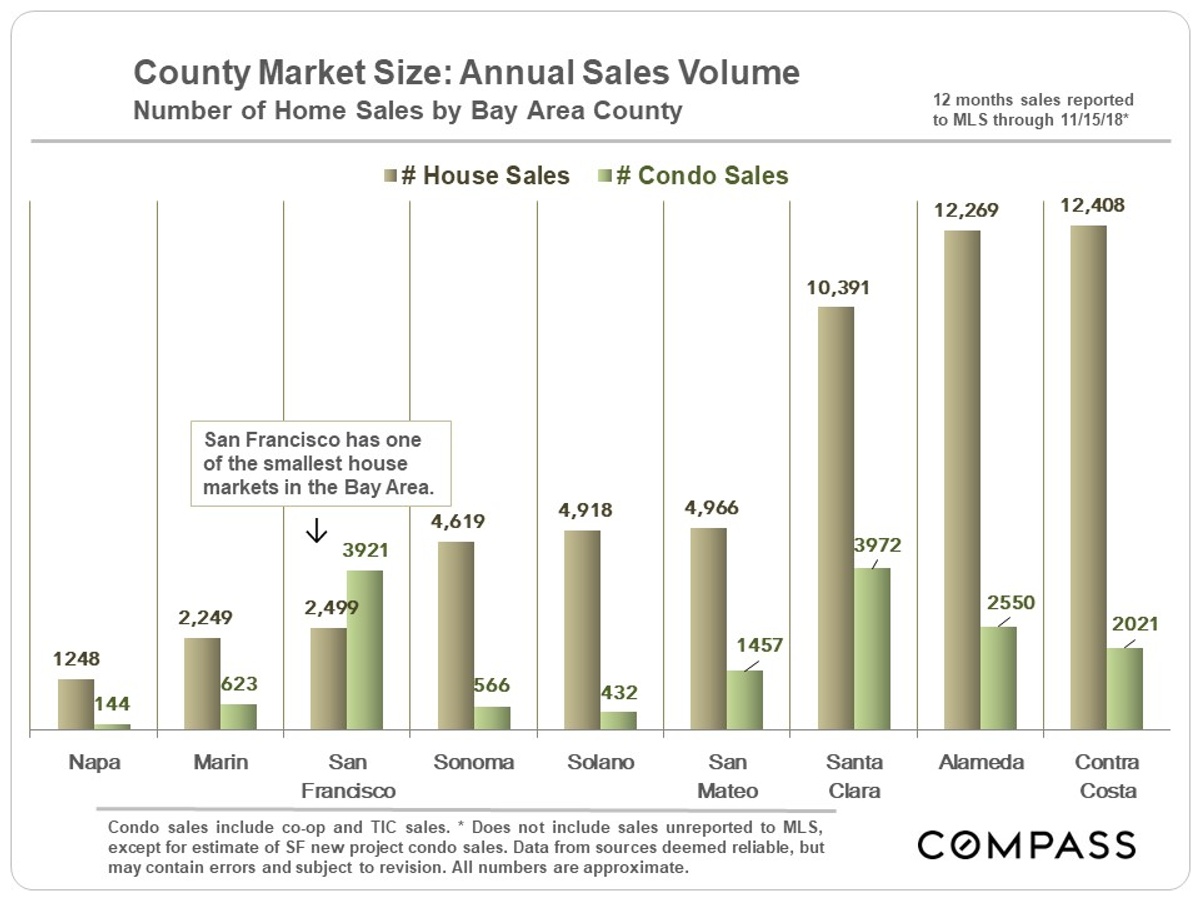
Sales Volumes by County
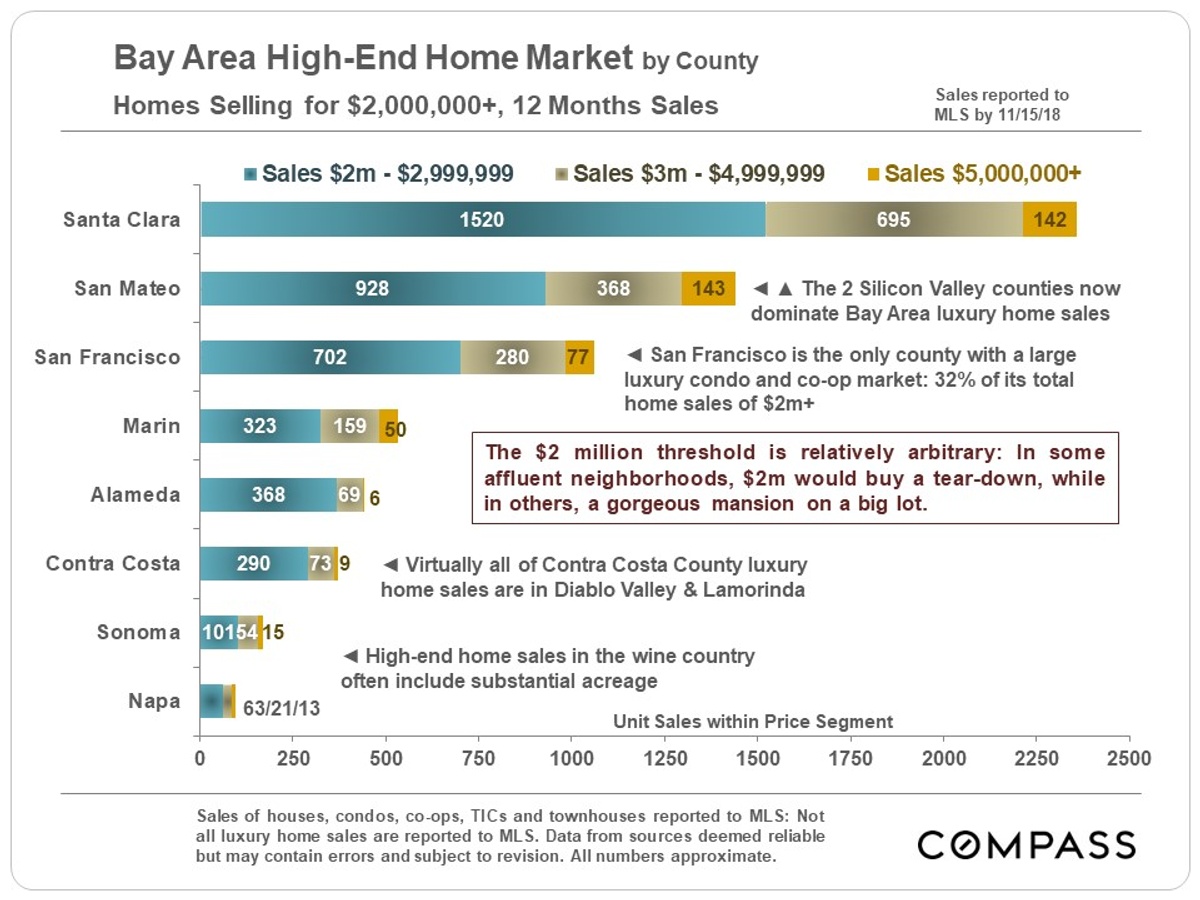
Bay Area Luxury Home Markets
There was no overall plunge in Bay Area luxury home sales this autumn: Year over year, sales ticked up about 6% in the 3-month period.
However, results varied by county: Santa Clara County – with more $3 million+ sales than any county in the state – saw a year-over-year decline of 14%. San Francisco luxury house sales were up 16%, but its luxury condo sales were flat. San Mateo was up 17%, Marin down 16%, Alameda and Contra Costa up 11%, and wine country luxury home sales increased by 26%. (Different price thresholds were used for the luxury designation depending on county.) These widely varying ups and downs muddy the picture of where the Bay Area luxury market is heading.
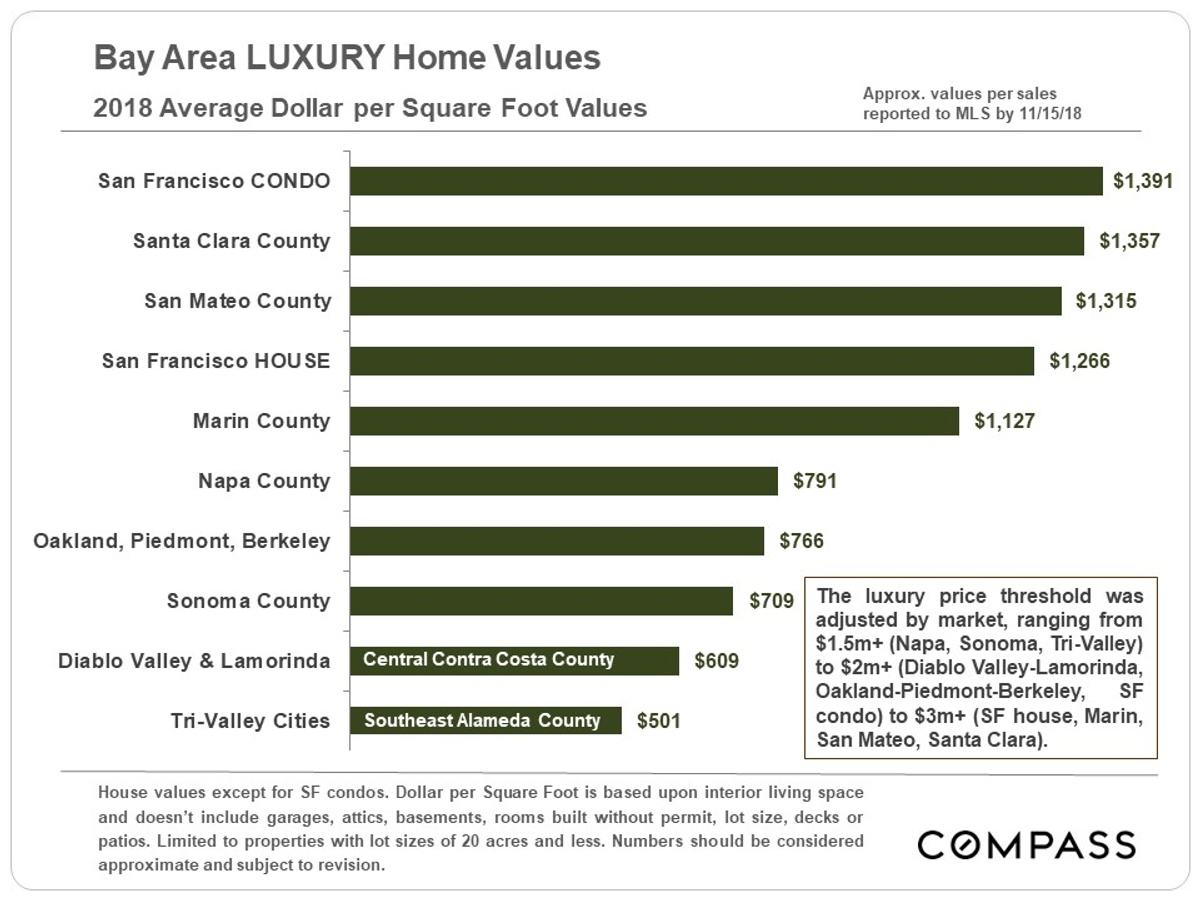
By a nose, San Francisco luxury condo sales top the list for highest average dollar per square foot values.
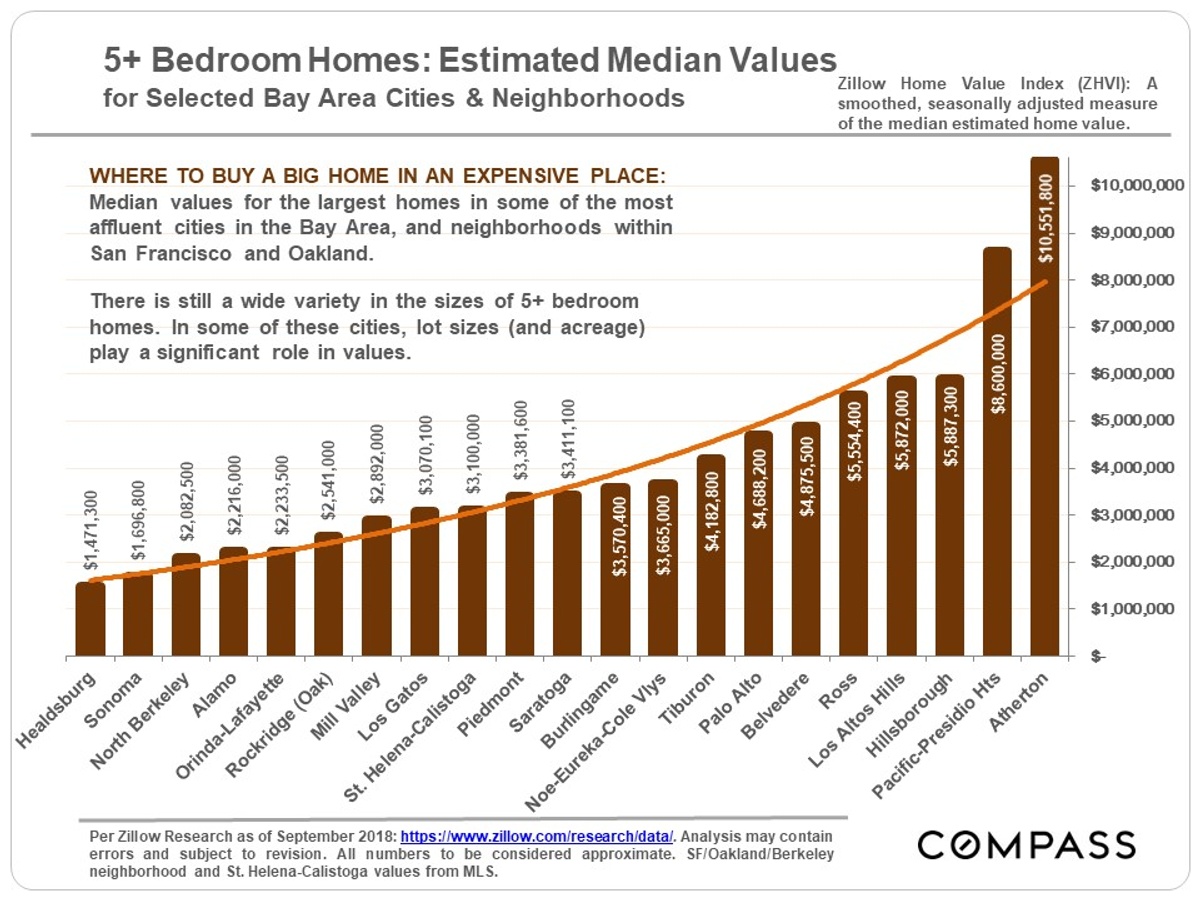
The Bay Area has a wide range of options in big, high-priced homes, with Atherton – recently designated the most expensive zip code in the country – and the neighborhoods of Pacific & Presidio Heights in San Francisco at the top of the price scale. (For those who don’t like yard work, there’s the option of a lavish penthouse condo or co-op in Russian Hill or South Beach.) There are homes or estates selling above $5 million – sometimes far above – in every county in the Bay Area, except Solano.
Supply & Demand Indicators
After 7 years of strong market recovery (or “up cycle”), there are preliminary signs of notable shifts in the market – but the magnitude of the changes vary considerably by statistic and by county. Though everyone wants to jump to definitive conclusions, it would be premature to confidently predict the course of a sustained, longer-term transition, if that is what is occurring. There are a lot of spinning plates in local, national and international economies and politics right now.
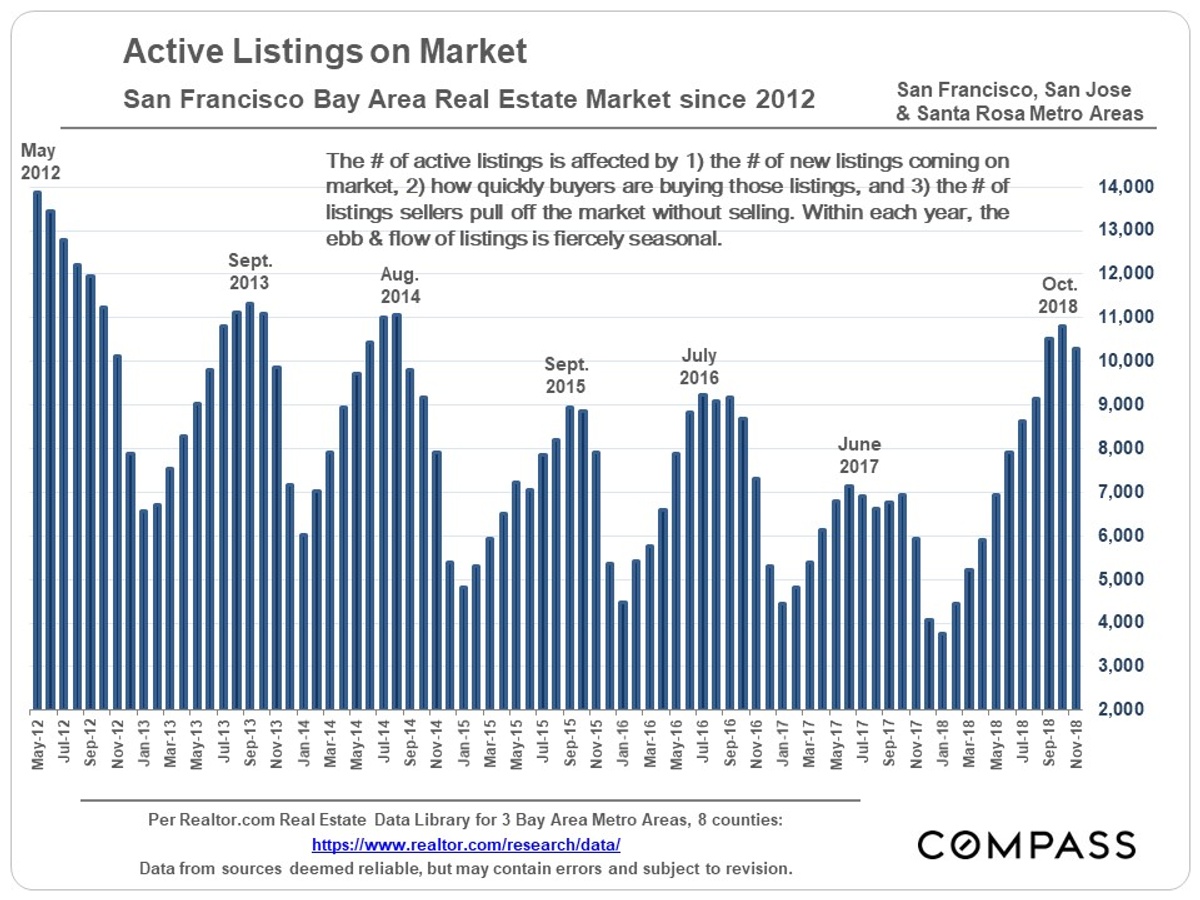
Listings vs. Sales
Though not especially high by historical standards, the overall supply of listings on the market has been appreciably increasing this autumn – to its highest level in 4 years (as charted below) – but sales volume in September-November 2018 was down about 12.5% on a year-over-year basis (not charted). That’s about 2000 fewer sales.
Generally speaking, during the recovery since 2012, an inadequate and often decreasing number of listings met increasing and sometimes feverish demand from buyers, adding immense upward pressure on home prices. For the time being at least, that pressure is now subsiding as the balance between supply and demand shifts.
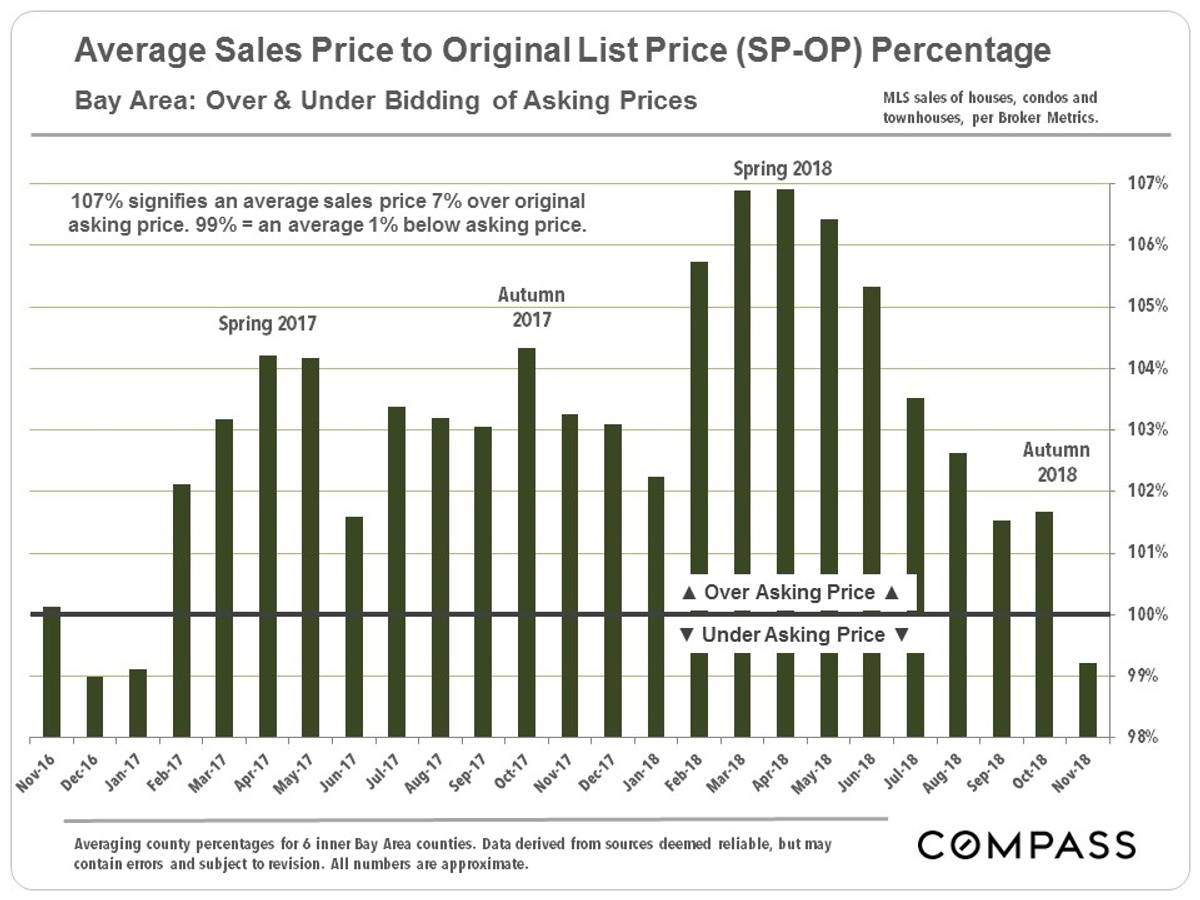
Overbidding & Under-Bidding
As demand declines and inventory increases, the competition between buyers – and the need to overbid asking price to win the sale – subsides. Seasonality plays a big role in this statistic, and there are still many homes selling for over asking price, but the overall average Bay Area sales-price-to-original-list-price percentage has dropped below asking price – by a smidge – for the first time since January 2017.
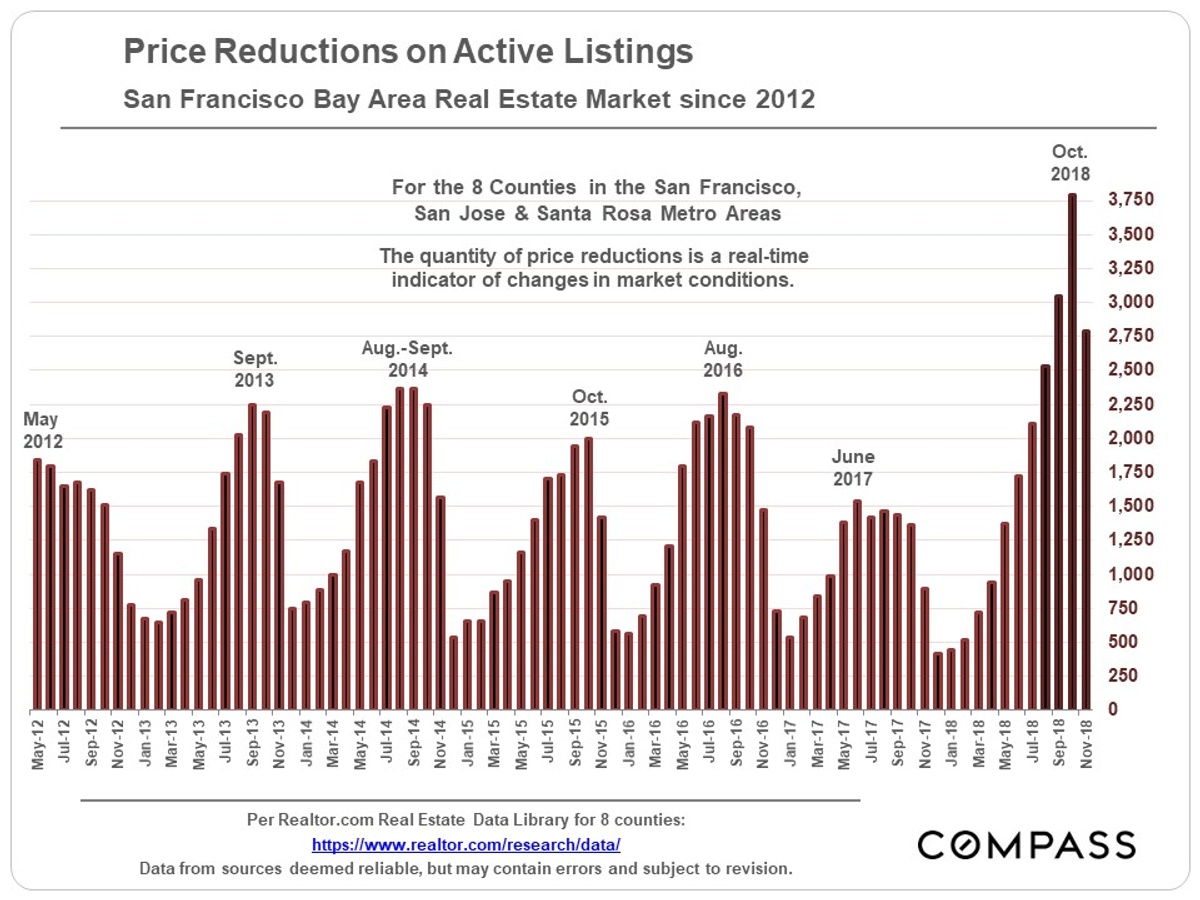
Price Reductions
The dramatic increase in price reductions is a stark indicator of changes in the supply and demand dynamic. October saw a massive spike, but September and November numbers were also much higher than in the previous 6 years. Price reductions are a measure of the difference between buyer and seller expectations as to fair market value.
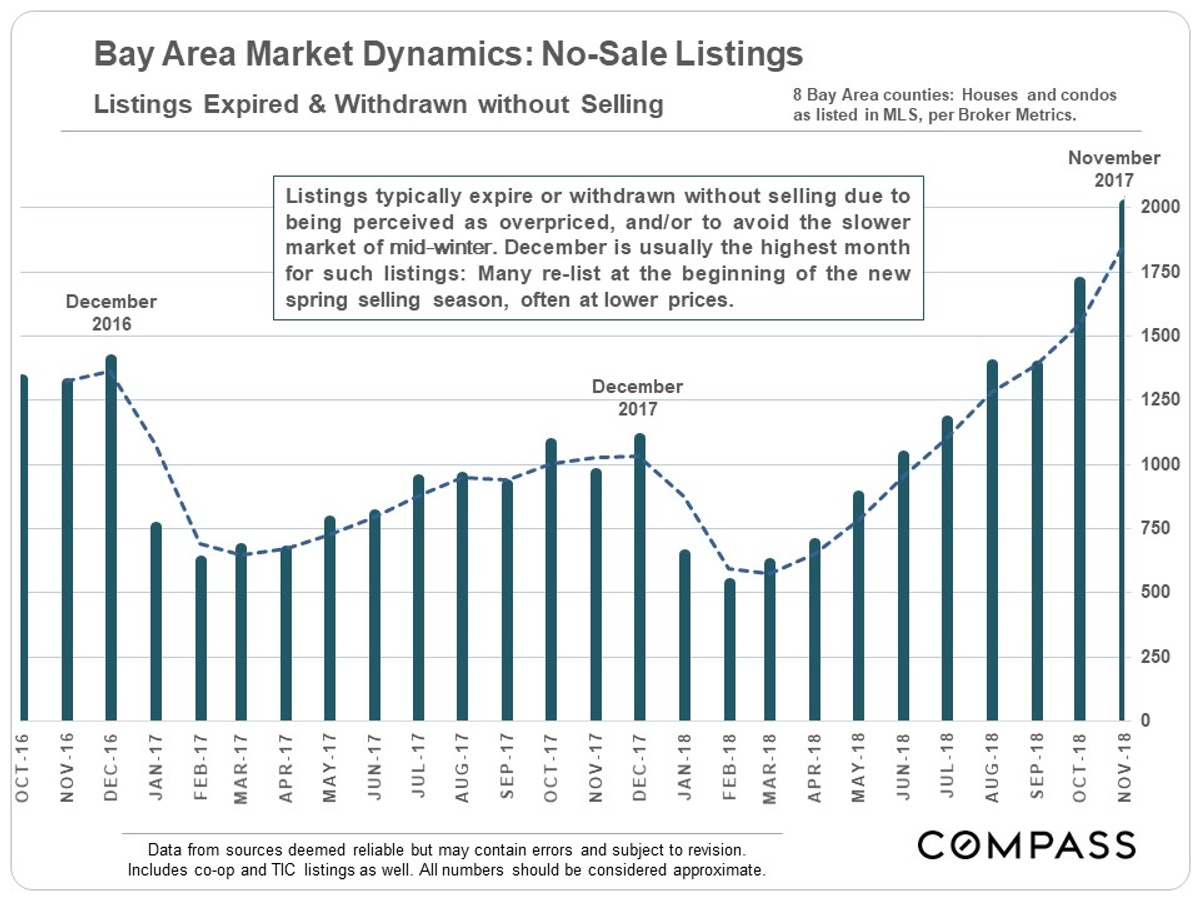
Expired & Withdrawn Listings – No Sale
The increase in listings taken off the market without selling – which jumped to about 2000 in November – is another indicator of disconnect between what sellers are willing to accept and buyers are willing to pay. Expired/withdrawn listings typically peak in December, so we may see a further increase next month. Many sellers who pull their homes off the market in November and December will try again next year.
Mixed Economic Indicators
Housing affordability is a huge social, political and market issue in the Bay Area. Though very low, current affordability percentages – as calculated by the CA Association of Realtors Affordability Index – are not quite as low as in 2007. (We cover affordability in a separate report.)
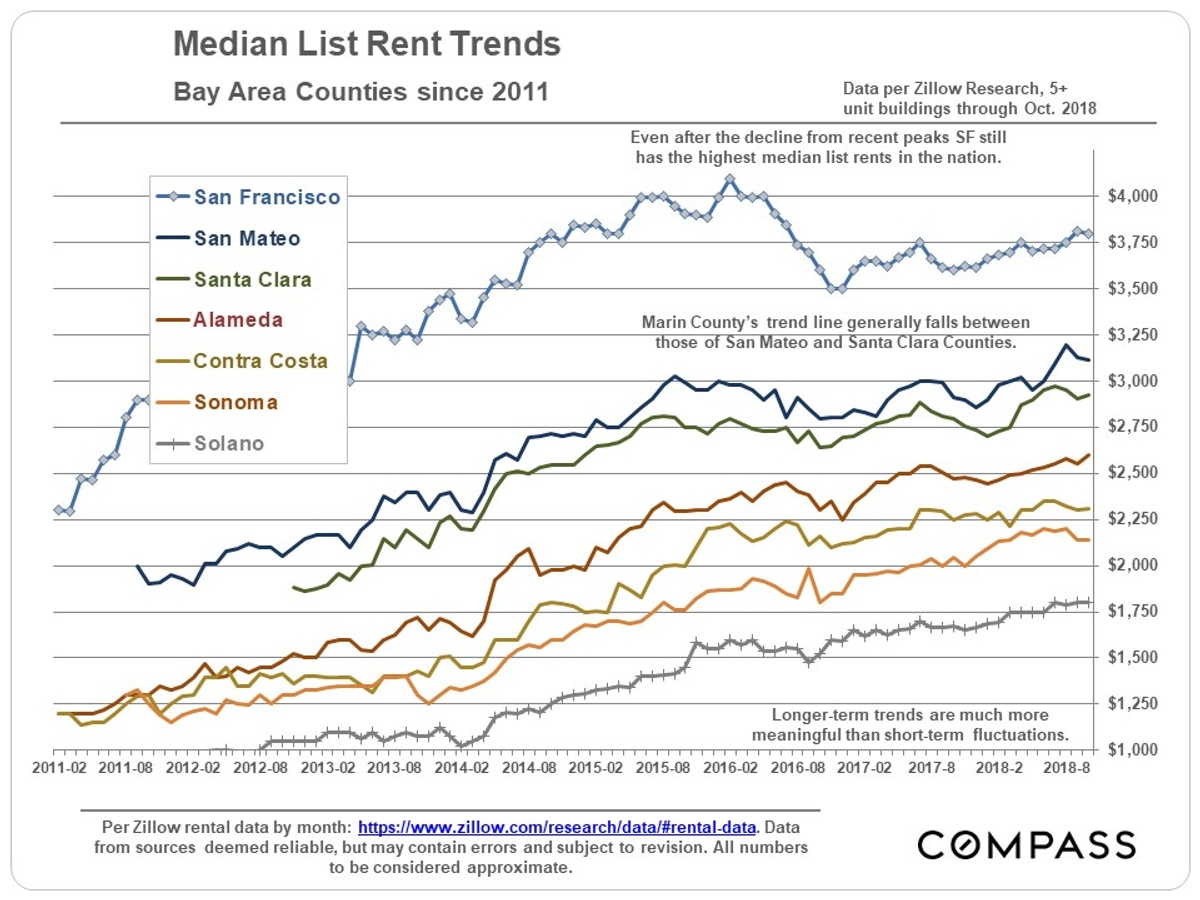
Bay Area Rents
Most economists expect to see something of a balance between what it costs to buy or to rent a home, but since 2015, rent increases have either moderated, or, in the case of San Francisco, rents have declined, while home prices and interest rates have increased substantially.
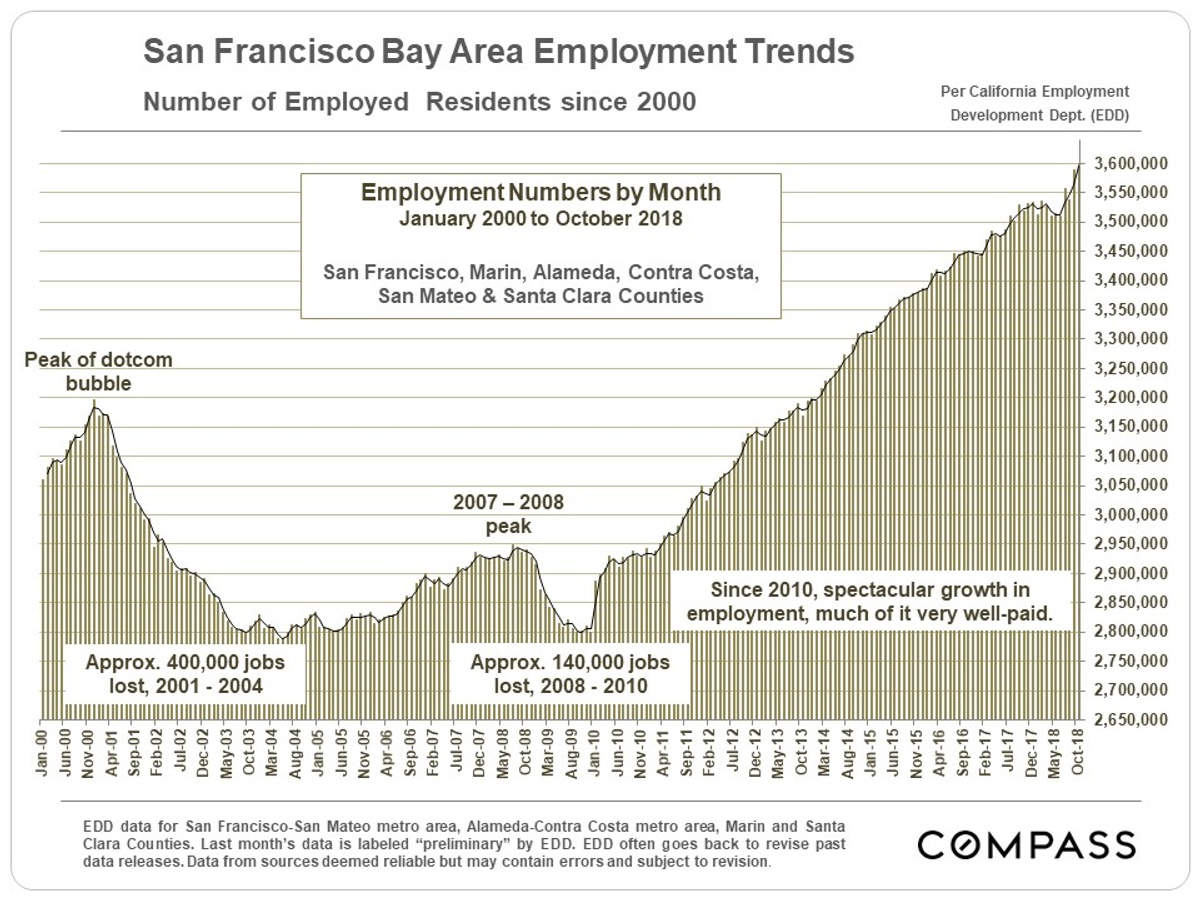
Employment
Since the last recession, the Bay Area has been one of the greatest job creating machines in the world. Unemployment rates are currently bumping along at historic lows.
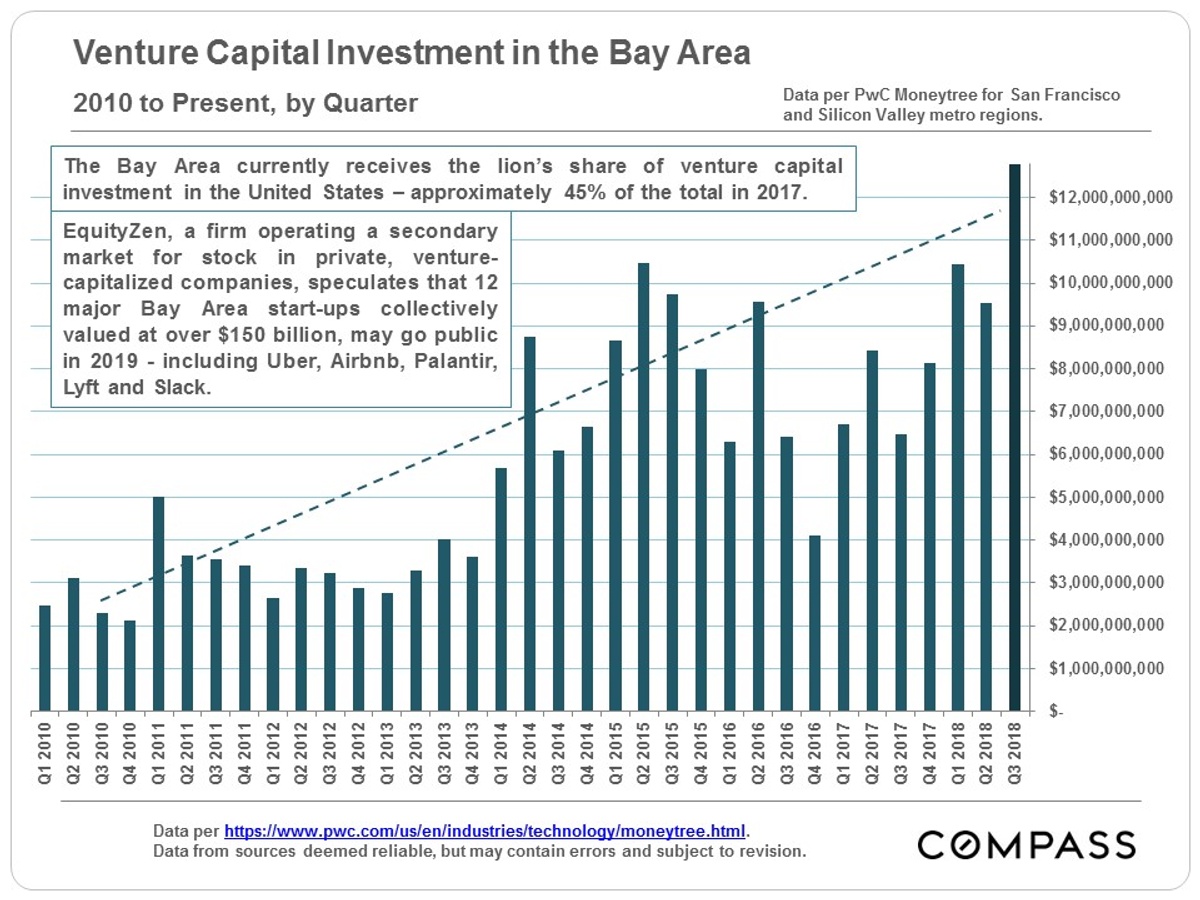
Money, Money, Money
The astonishing amount of venture capital sloshing into the Bay Area affects the overall economic environment and its housing markets. When start-ups go public they can pour additional, immense quantities of new wealth into the pockets of founders, investors and employees – and then into the surrounding economy. Some major local unicorns have stated their intention to go public in 2019, though continued stock market volatility may affect those plans.
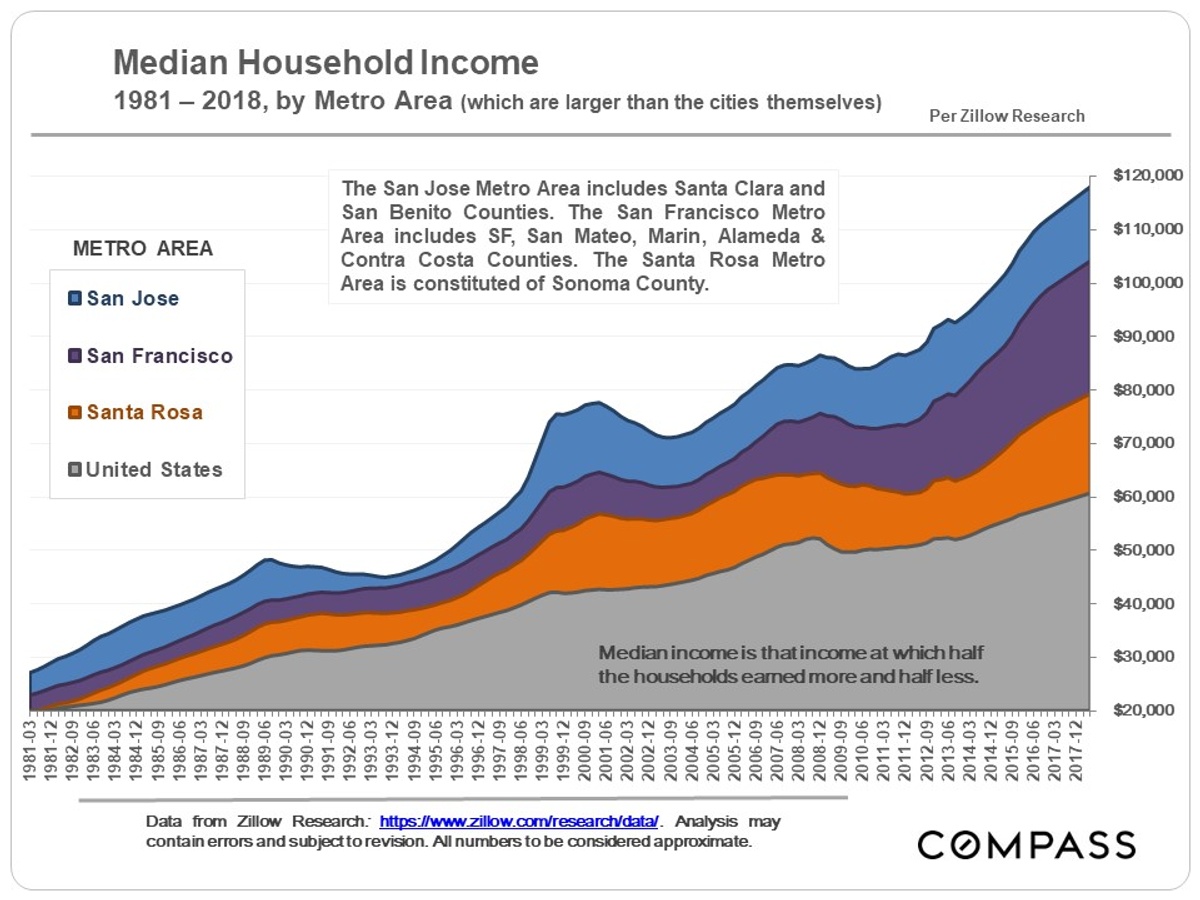
Local median household incomes have risen well above the national median. Among other factors, the people moving into the Bay Area tend to be more affluent than those moving out. (However, local poverty rates have also risen in recent years.)
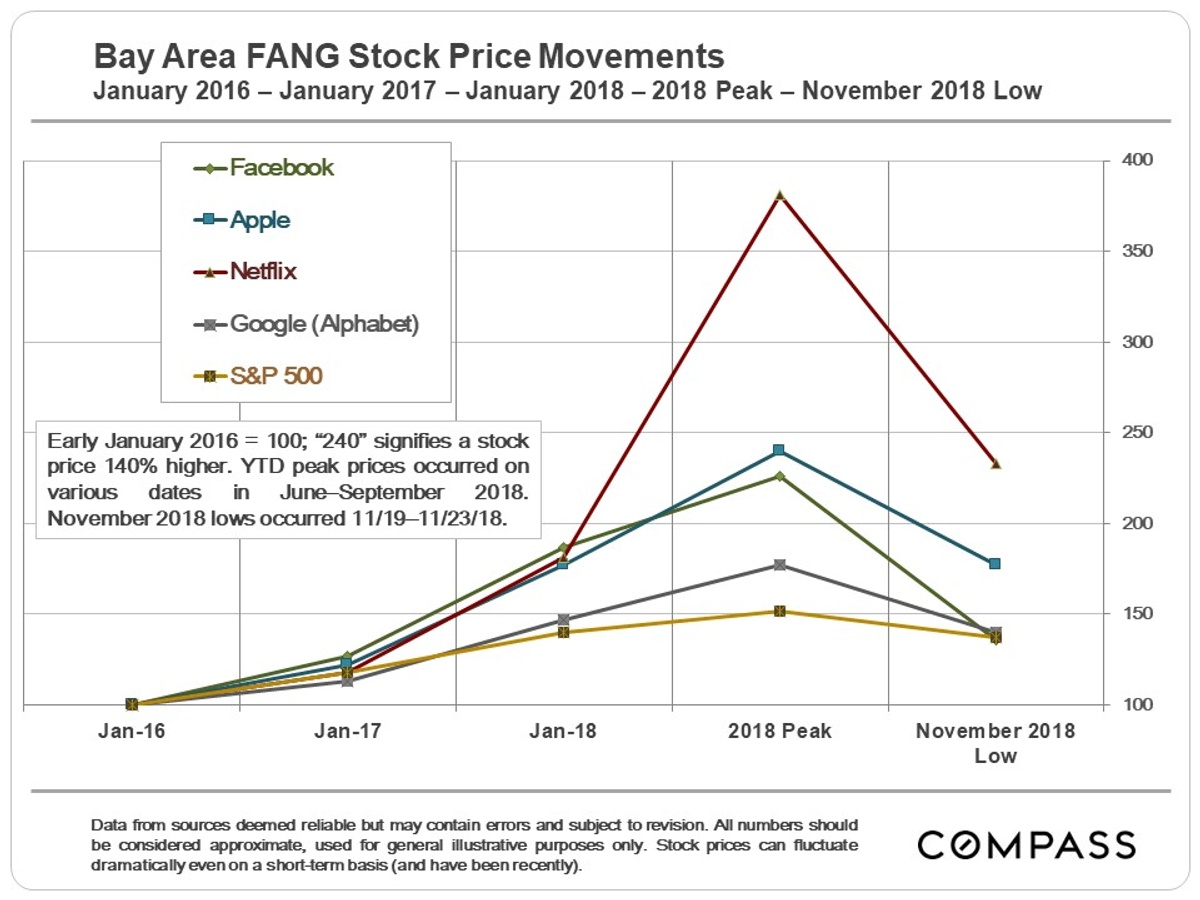
Stock Prices
The S&P 500 saw an incredible surge in value from January 2016 through late September 2018 – rising about 50% – but its increase looks distinctly modest compared to the astounding share price movements of some of our local high-tech giants. Soaring stock values make people feel wealthier, more optimistic about the future, more willing to take on new debt, and more positive about buying new homes (and everything else). But when financial markets get volatile, sometimes seeing sudden, precipitous declines – as has occurred in recent months – buyers often become cautious.
Note that as of early December, financial markets have lurched up and down again since their late November lows, i.e. a queasy, high market volatility continues.
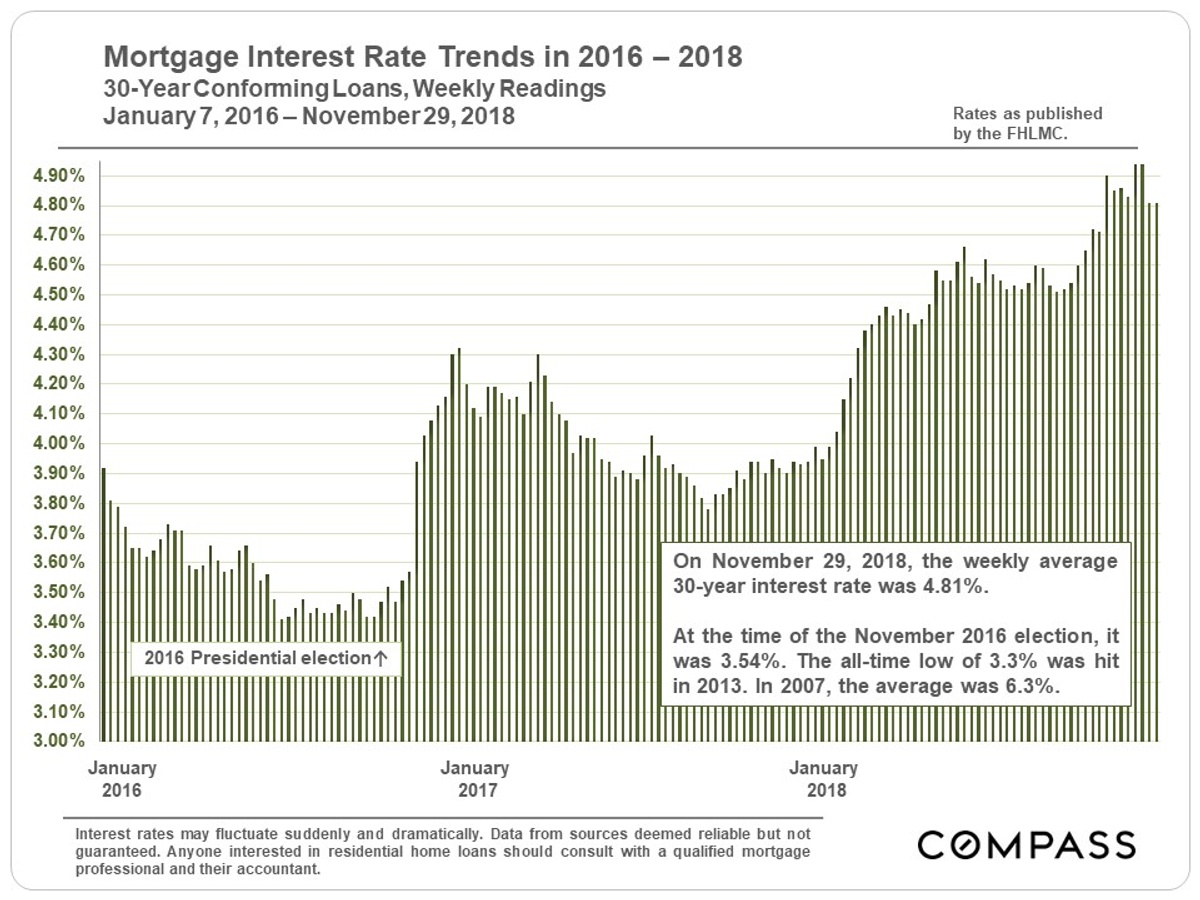
Interest Rates
Through spring 2018, home buyers appeared to shrug off concerns about rising interest rates, but that seems to be changing as rates continue to adversely affect affordability. Besides mortgage costs, increasing interest rates affect debt of all kinds, and whether private, corporate or governmental, debt levels around the world are generally at historic highs. High debt plus rising rates can be a dangerous economic indicator.
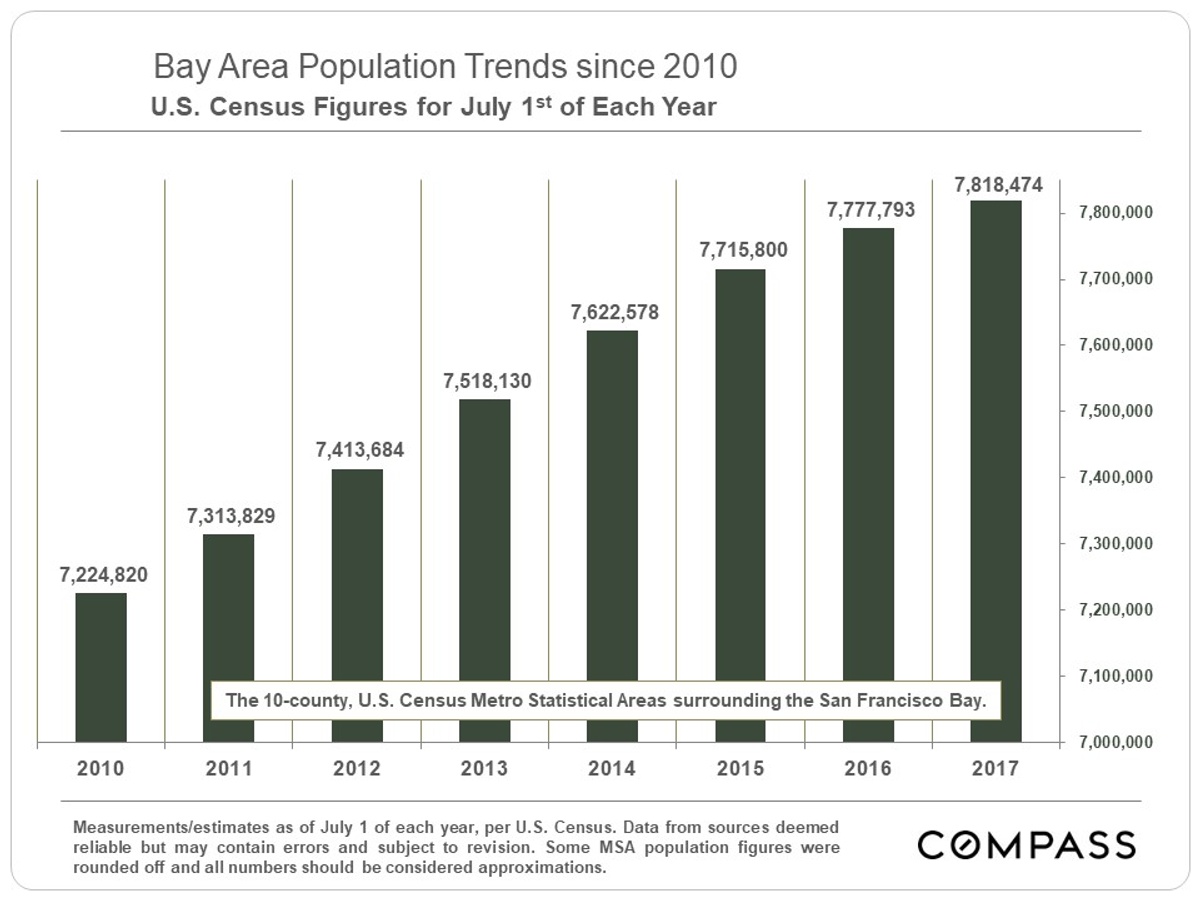
Population Growth & Migration
Increasing populations without a concomitant increase in new housing pressures rents and prices. Right now, California and Bay Area populations continue to grow, but at a reduced rate from recent years. Of course, population growth itself has both positive and negative economic and quality of living effects depending on the viewpoint.
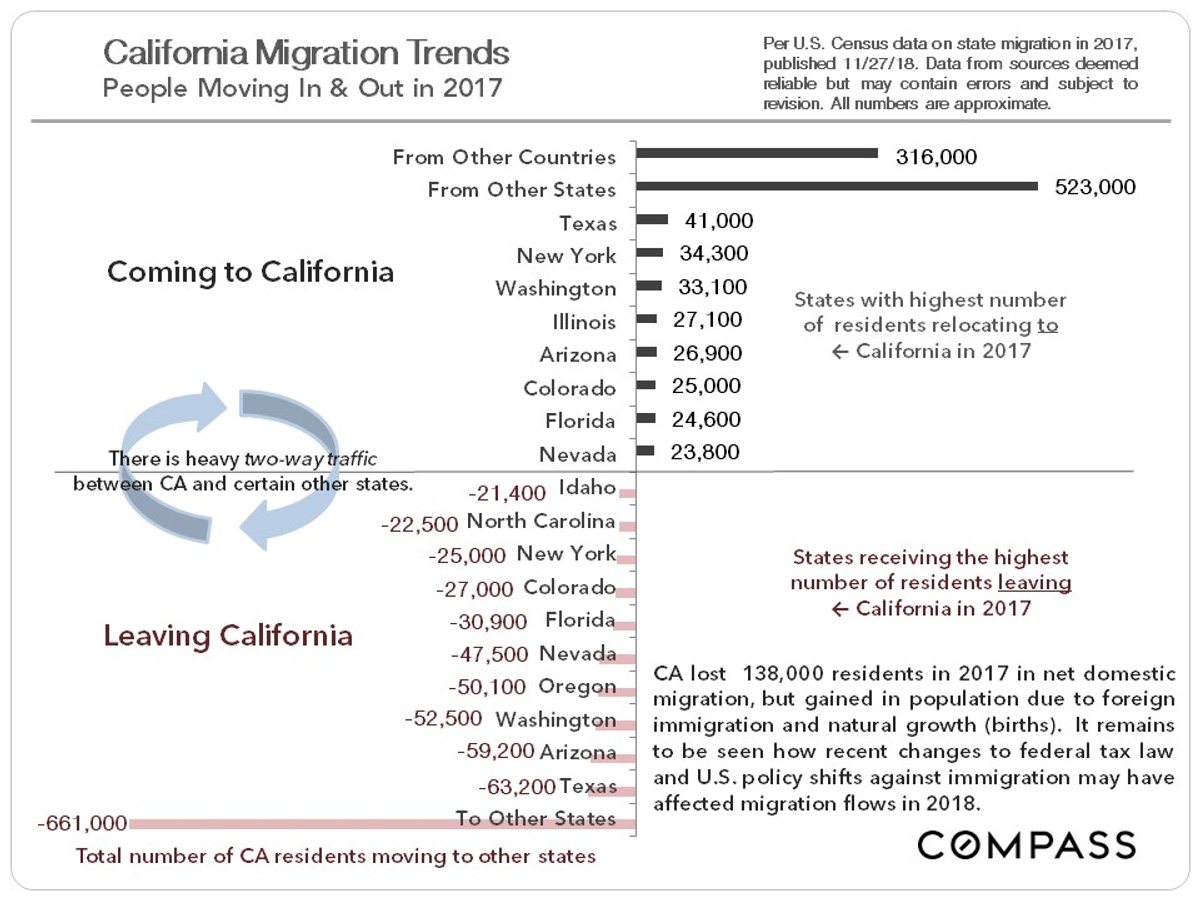
The new U.S. Census state-to-state migration data for 2017 is illustrated below. Generally speaking, the Bay Area has followed state trends, i.e. more people moving out than moving in domestically, but that deficit more than made up by foreign immigration. Employment and/or cost of living issues, including housing affordability, are probably the dominant factors in these migration figures. It will be interesting to see whether the new 2018 federal tax law changes and the increasingly negative U.S. government attitude to immigration affect 2018 migration figures.

Jeff Salgado
DRE#: 01501886
415.915.9916
jeff(at)jeffsalgado(dotted)com
© Compass 2018 ¦ All Rights Reserved by Compass ¦ Made in NYC
Compass is a licensed real estate broker (01991628) in the State of California and abides by Equal Housing Opportunity laws. All material presented herein is intended for informational purposes only. Information is compiled from sources deemed reliable but is subject to errors, omissions, changes in price, condition, sale, or withdraw without notice. No statement is made as to accuracy of any description. All measurements and square footages are approximate. Exact dimensions can be obtained by retaining the services of an architect or engineer. This is not intended to solicit property already listed