

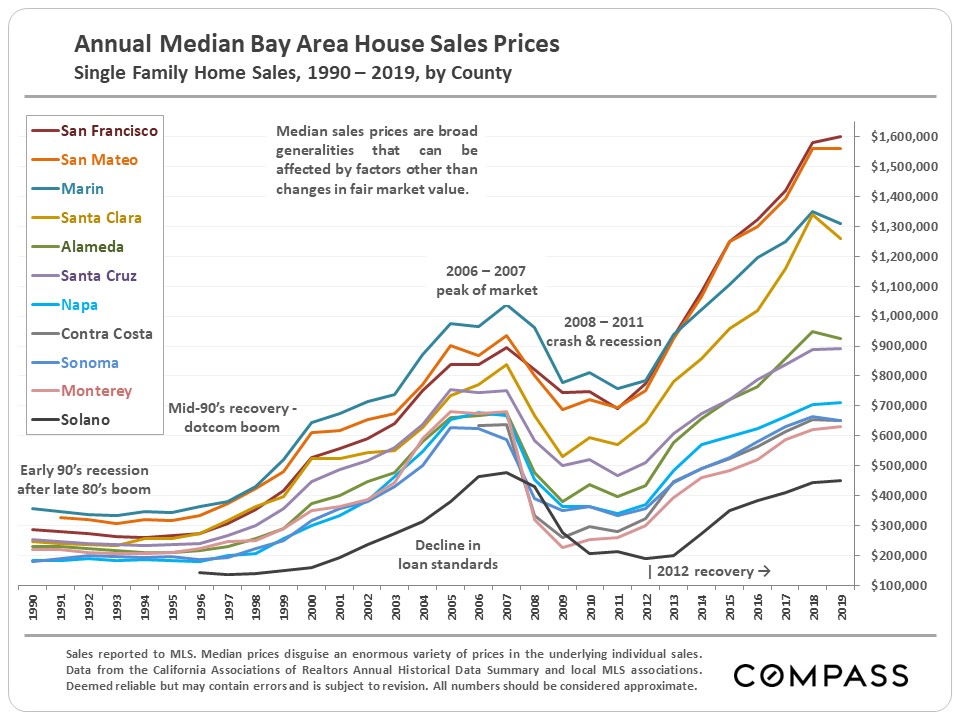
It’s important to note that the Bay Area contains many different markets and market segments, sometimes following diverging trends in supply and demand, and home-price appreciation. Most of the materials in this report reflect overall trends for the entire region.
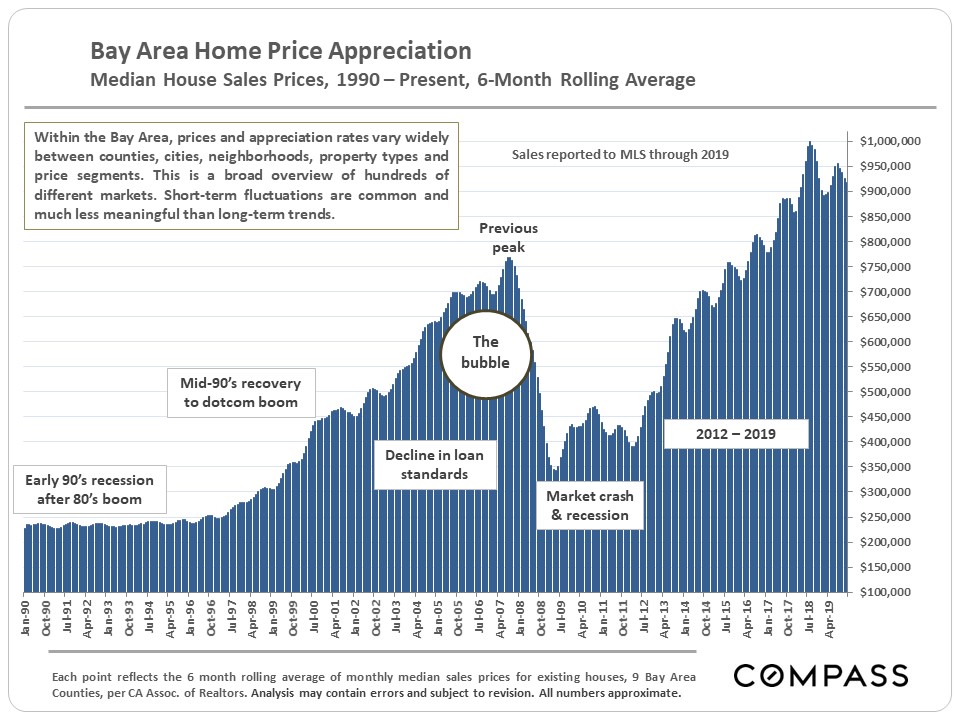
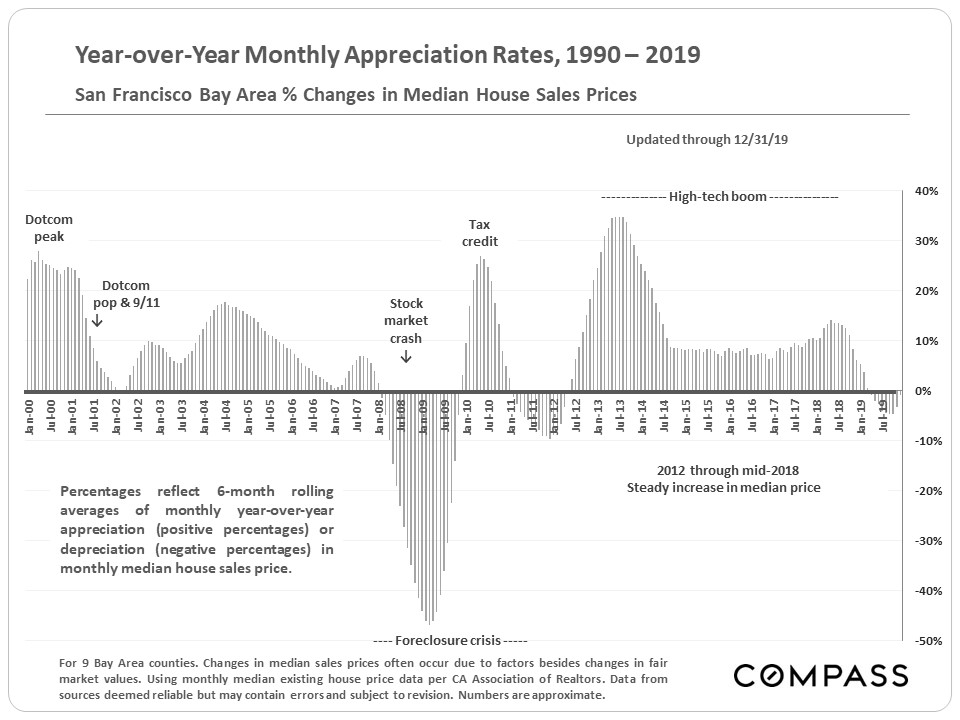
When the data is available we’ve charted longer-term trends since they give much greater context to what the state of the market is today, and where it may be heading.
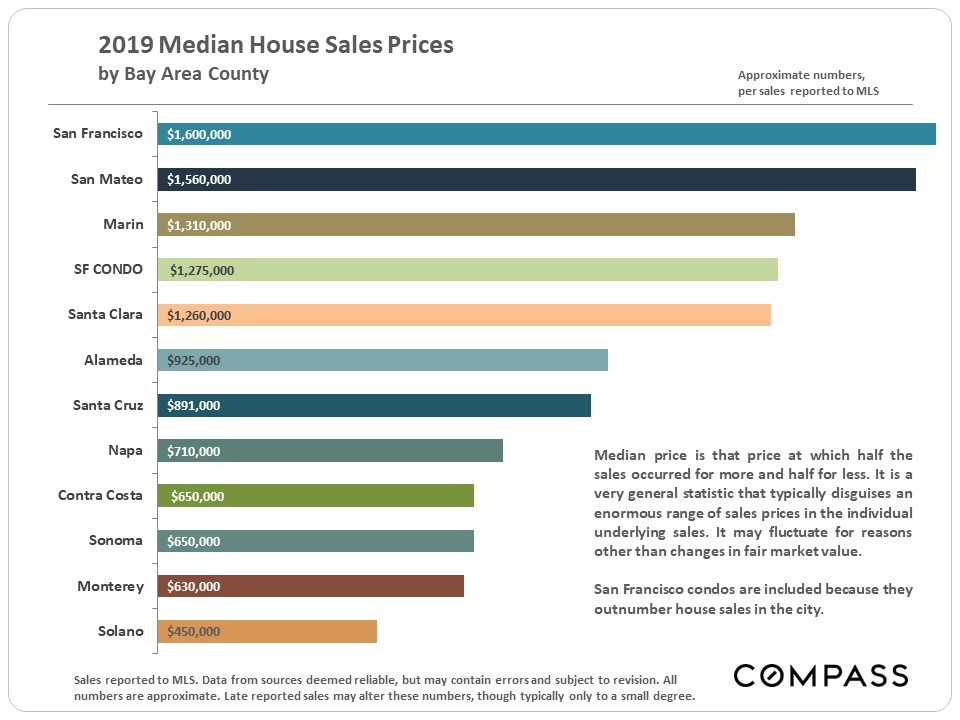
How these statistics pertain to any particular home is unknown without a specific comparative market analysis.

Jeff Salgado
DRE#: 01501886
415.915.9916
jeff(at)jeffsalgado(dotted)com
© Compass 2020 ¦ All Rights Reserved by Compass ¦ Made in NYC
Compass is a real estate broker licensed by the State of California operating under
multiple entities. License Numbers 01991628, 1527235, 1527365, 1356742, 1443761, 1997075,
1935359, 1961027, 1842987, 1869607, 1866771, 1527205, 1079009, 1272467. All material presented
herein is intended for informational purposes only and is compiled from sources deemed reliable
but has not been verified. Changes in price, condition, sale or withdrawal may be made without
notice. No statement is made as to accuracy of any description. All measurements and square
footage are approximate. Equal Housing Opportunity.