
![]()

San Francisco Q2 2019
Market Report
High stock markets, low interest rates, surging luxury home sales, limited inventory, a spring full of unicorn IPOs, and San Francisco – once again -hits new highs in median home sales prices.
July 2019 Update
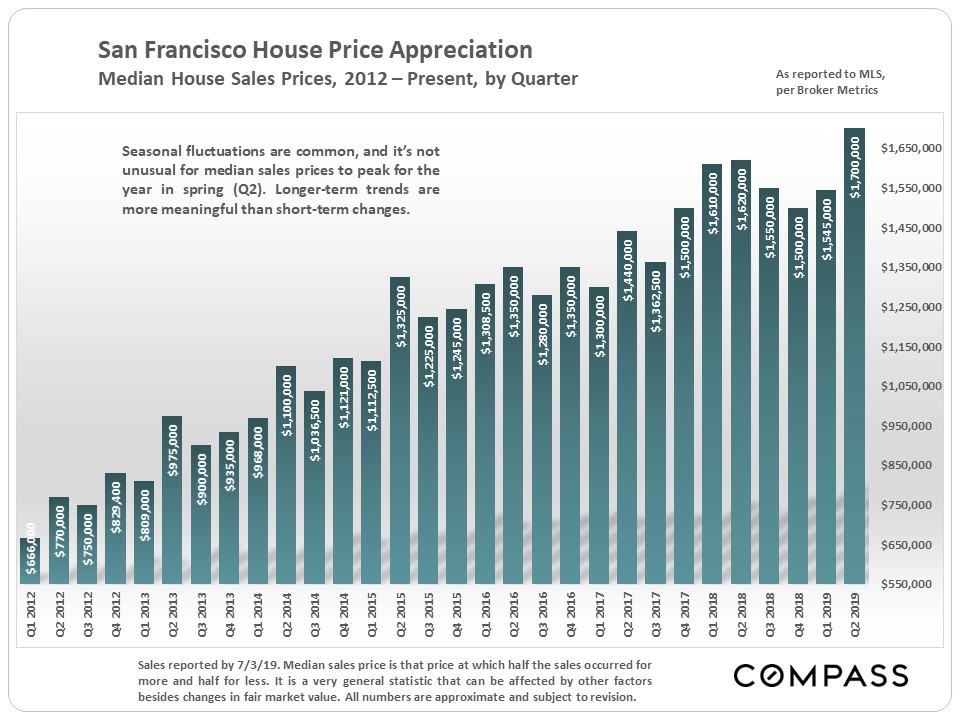
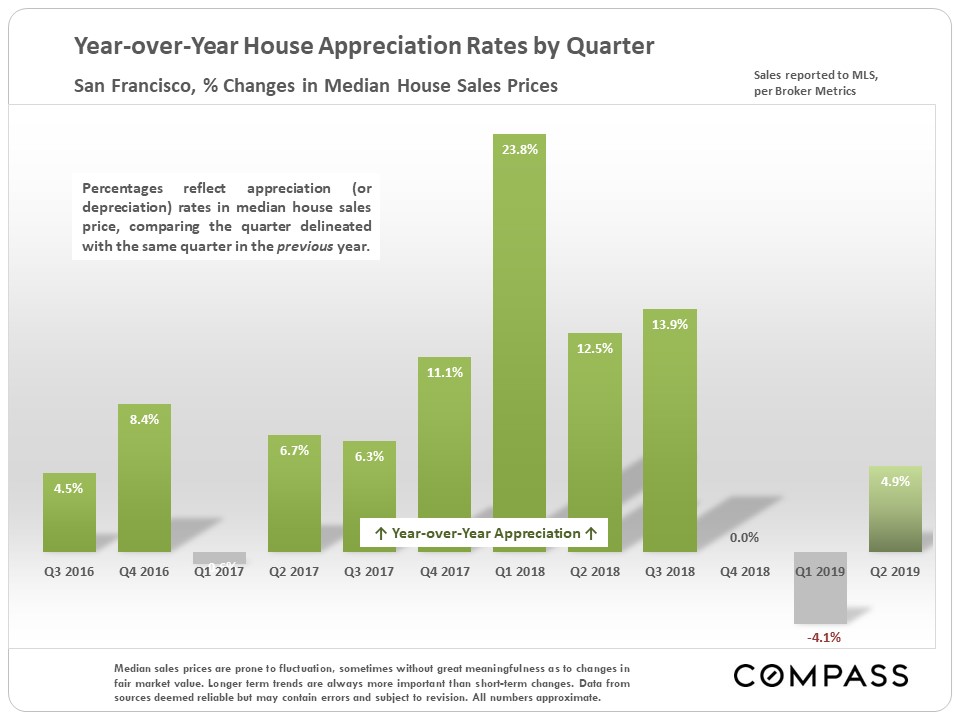
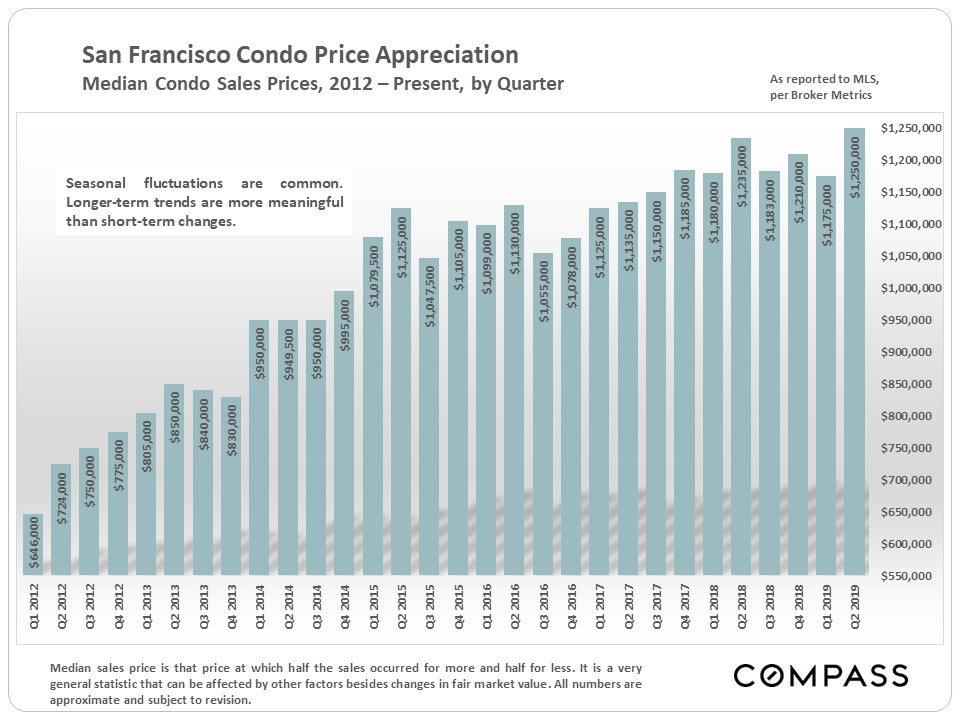
After 2 quarters of no or negative year-over-year home price appreciation, a confluence of positive economic factors sent San Francisco median home sales prices to new peaks in Q2. On a quarterly basis, the median house sales price hit $1,700,000 – $80,000 above the previous peak in Q2 2018 – powered by a monthly high of $1,770,000 achieved in June. For condos, the new quarterly median price peak was $1,250,00 – slightly above last year’s $1,235,000 – fueled by a new monthly high of $1,300,000 in June.
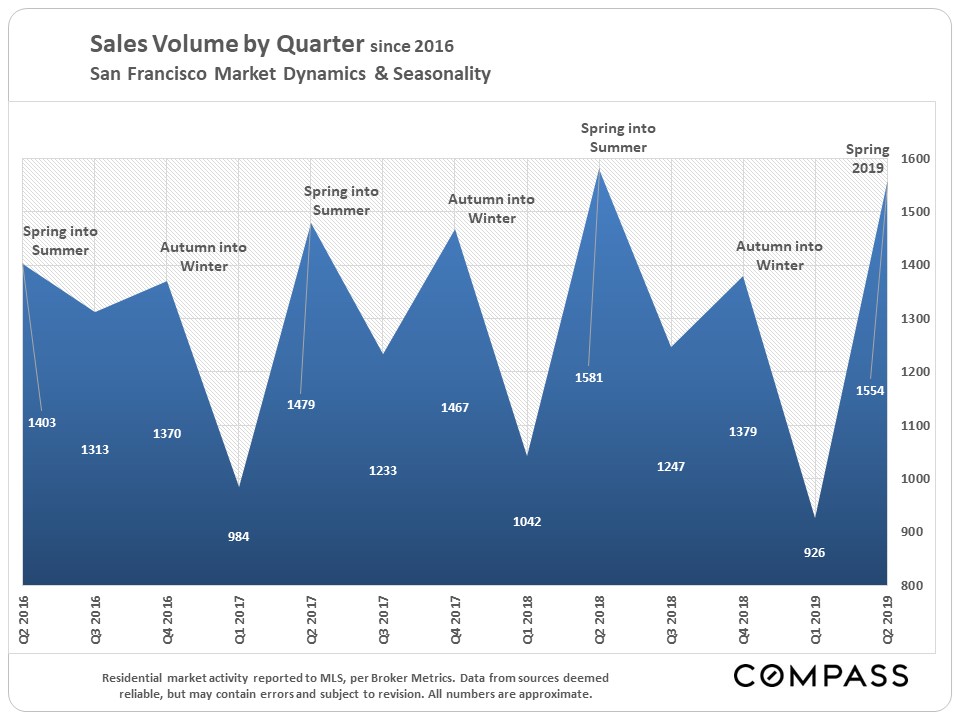
The market typically slows down significantly in San Francisco for the summer holidays through August before picking up again in September for a busy, though relatively short autumn selling season running through mid-November.
Median Home Sales Price Trends
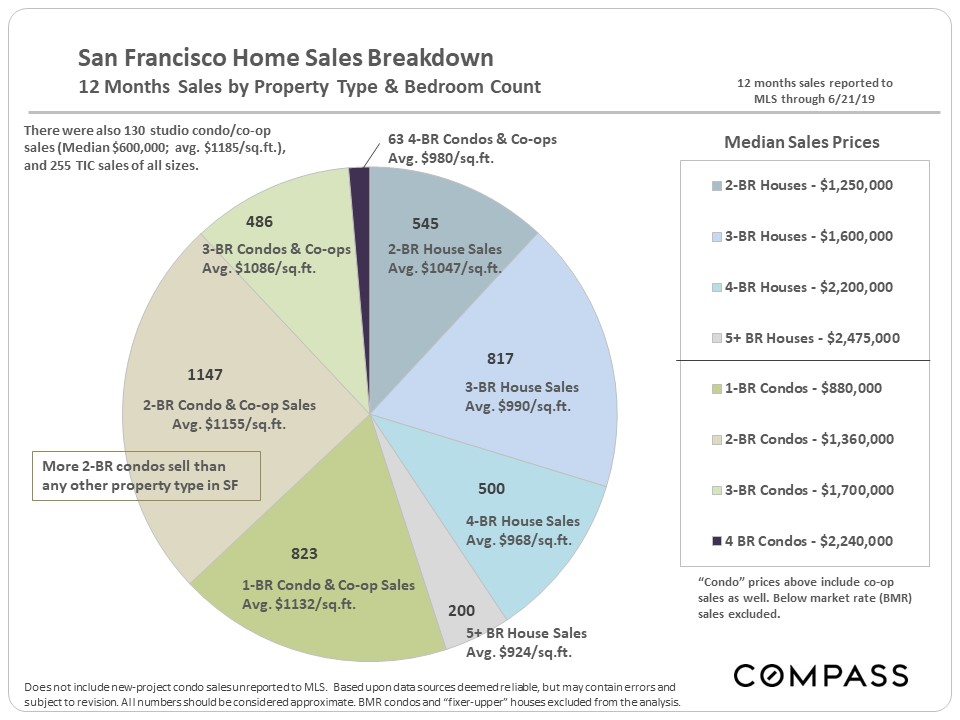
Sales & Prices by Property Type & Bedroom Count
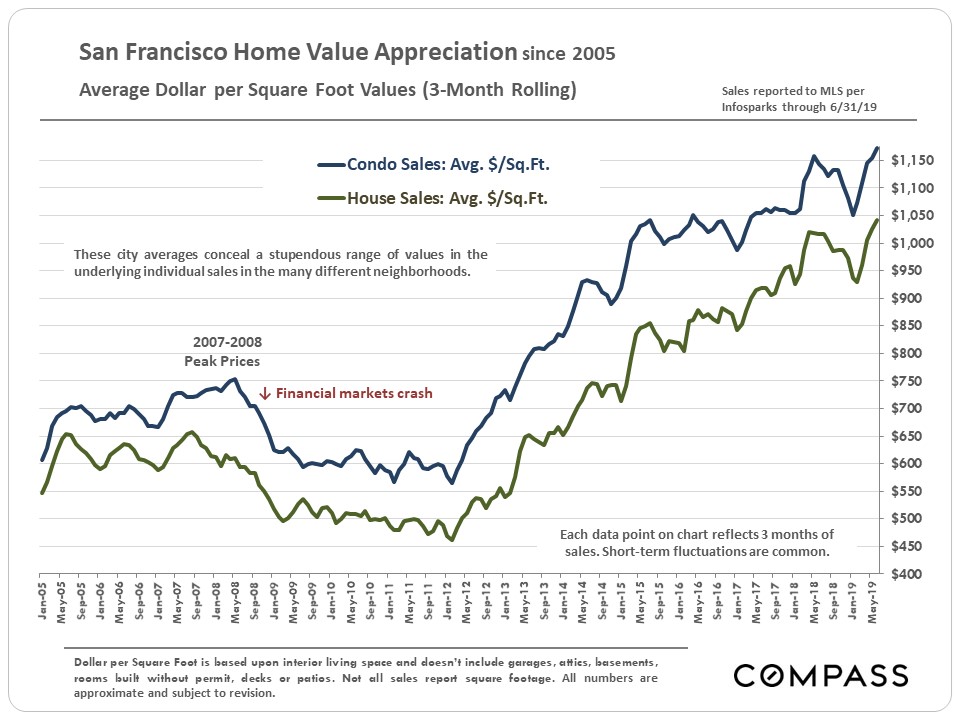
Average Dollar per Square Foot Analyses
As with median sales prices, average dollar per square foot values reached new highs in Q2, bouncing back dramatically from the recent plunge. Overall, condos see higher dollar per square foot values than houses in San Francisco.
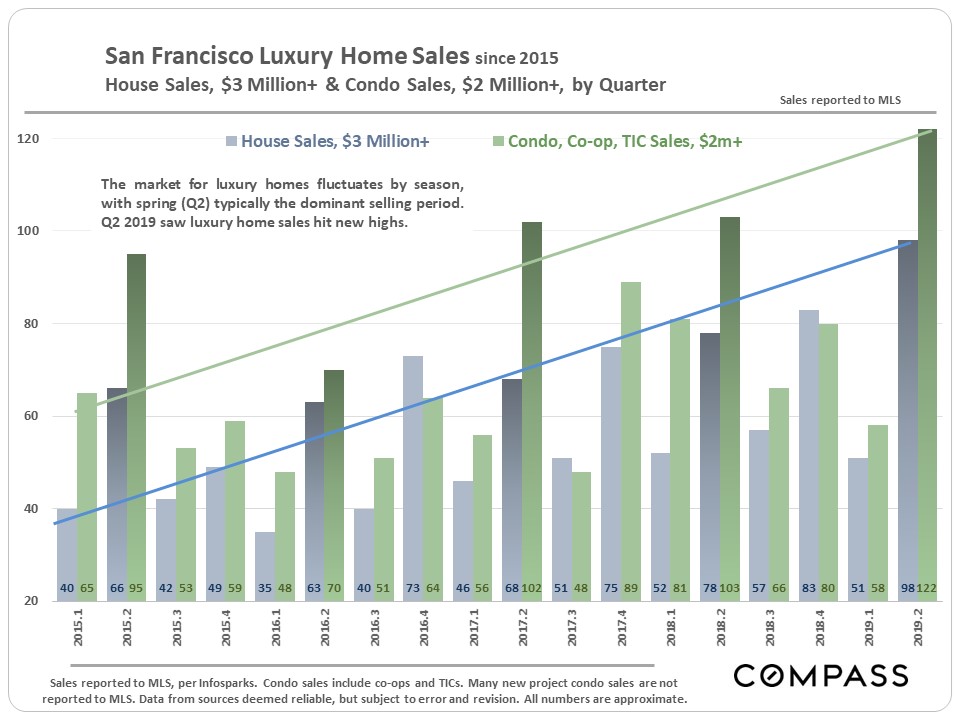
San Francisco Luxury Home Sales
Hit New Peaks in Q2 2019
The first chart below breaks out luxury homes as defined by houses selling for $3 million and above, and condos, co-ops and TICs selling for $2 million or more.
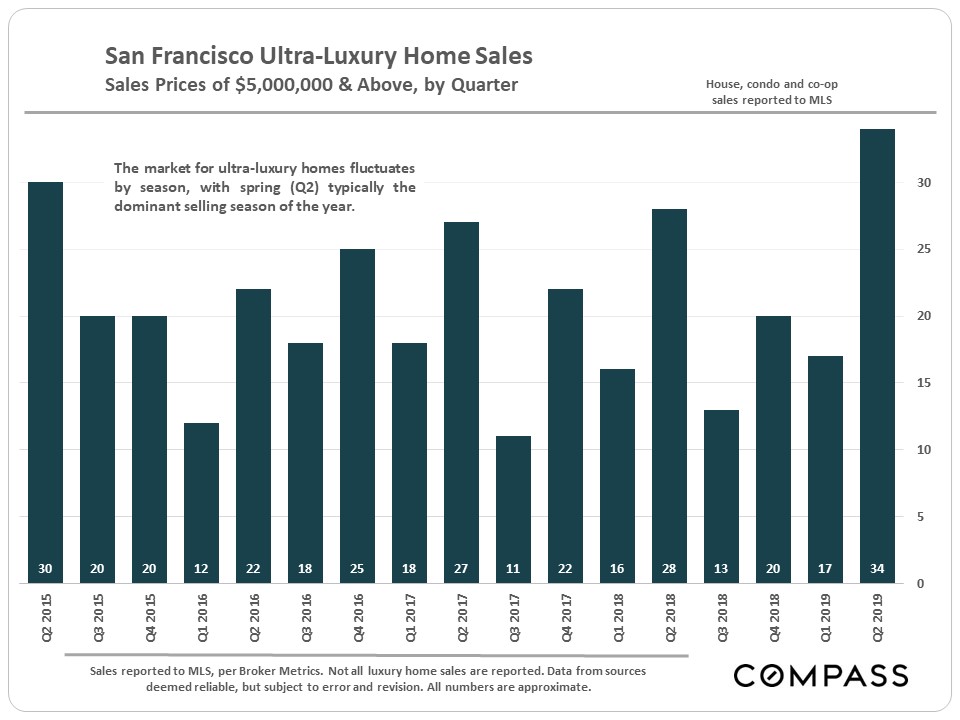
The second chart looks at all home sales of $5 million plus.
Selected Supply & Demand Statistics
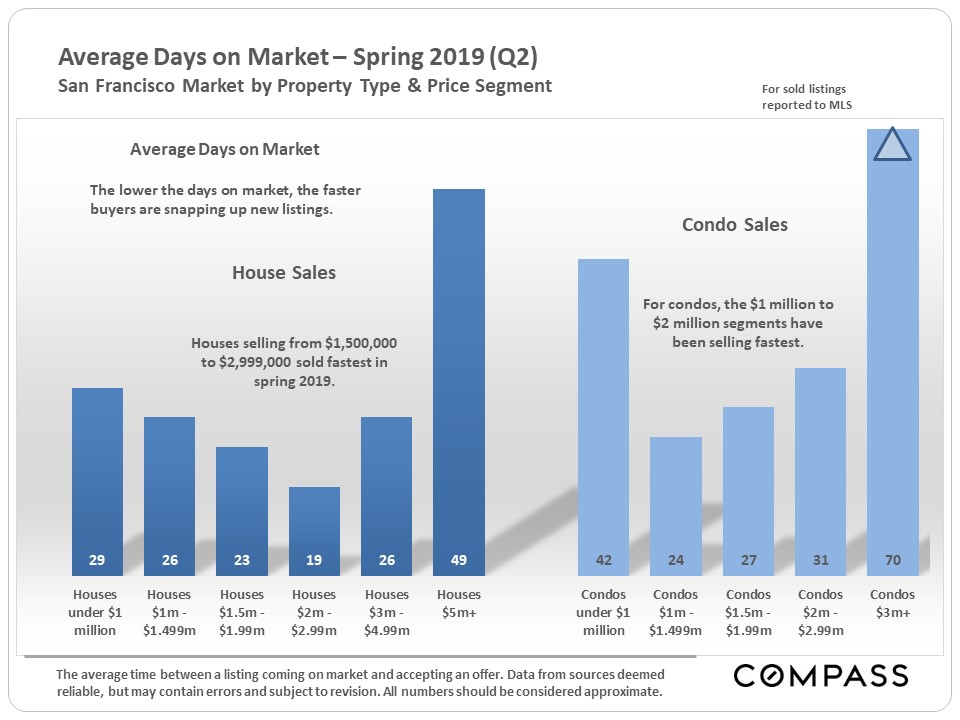
Average days on market broken out by property type and price segment: Changing a pattern seen in recent years, Q2 2019 often saw the strongest buyer demand in higher price segments. Demand for houses remains higher than that for condos, as houses have become the scarcer resource in the city.
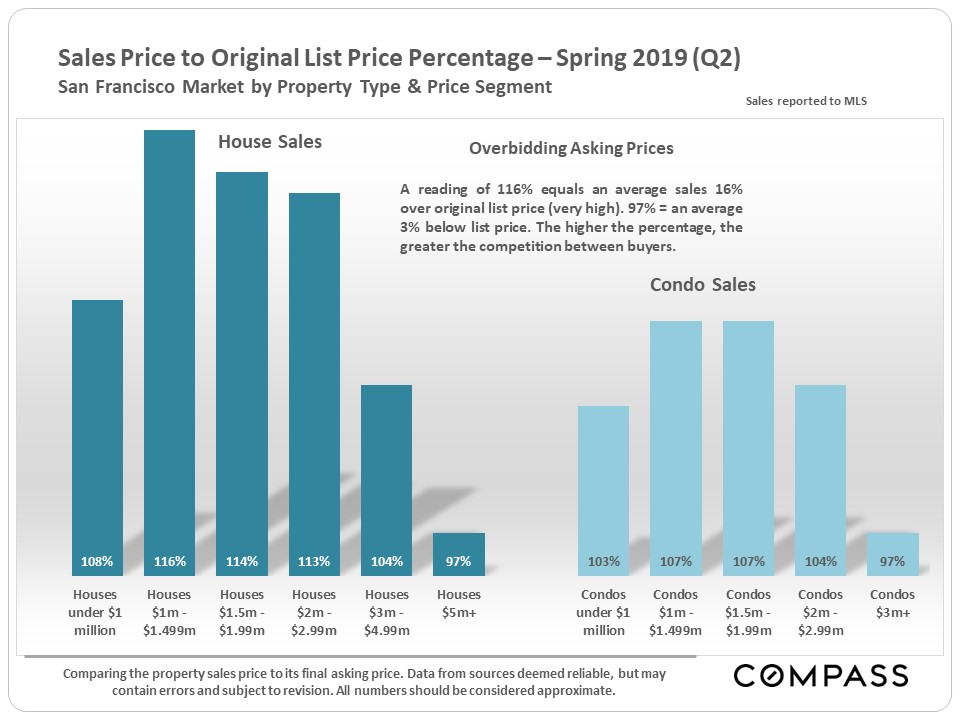
Sales price to original list price percentages by property type and price segment – these statistics generally mirror those seen above. Some of these percentages are stupendously high, reflecting torrid bidding competitions between buyers for appealing new listings.
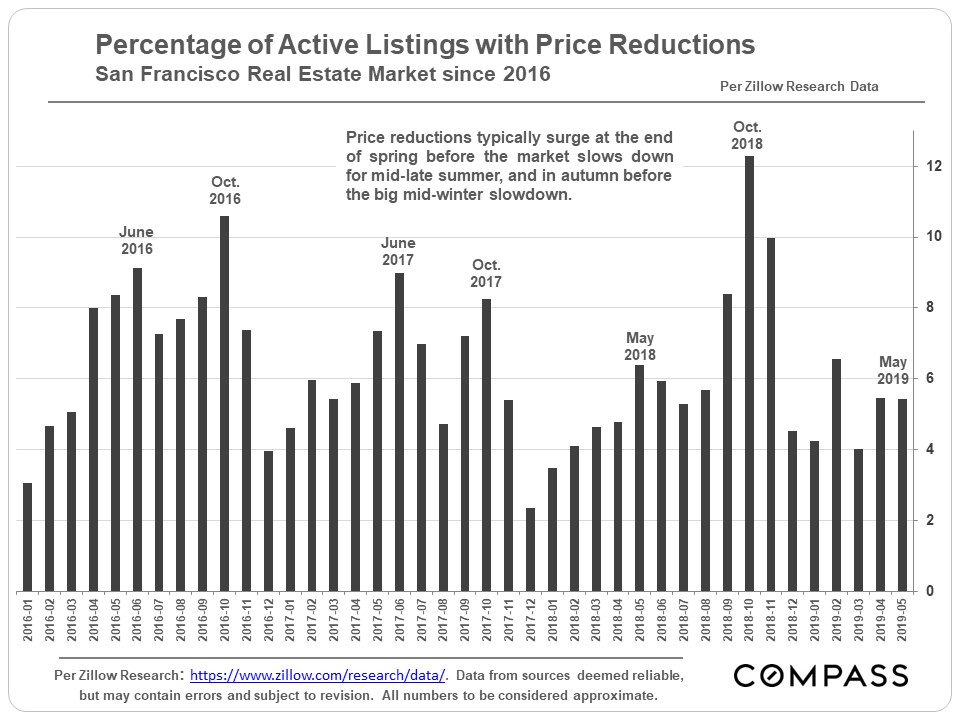
Percentage of Active Listings
with 1 or More Price Reductions
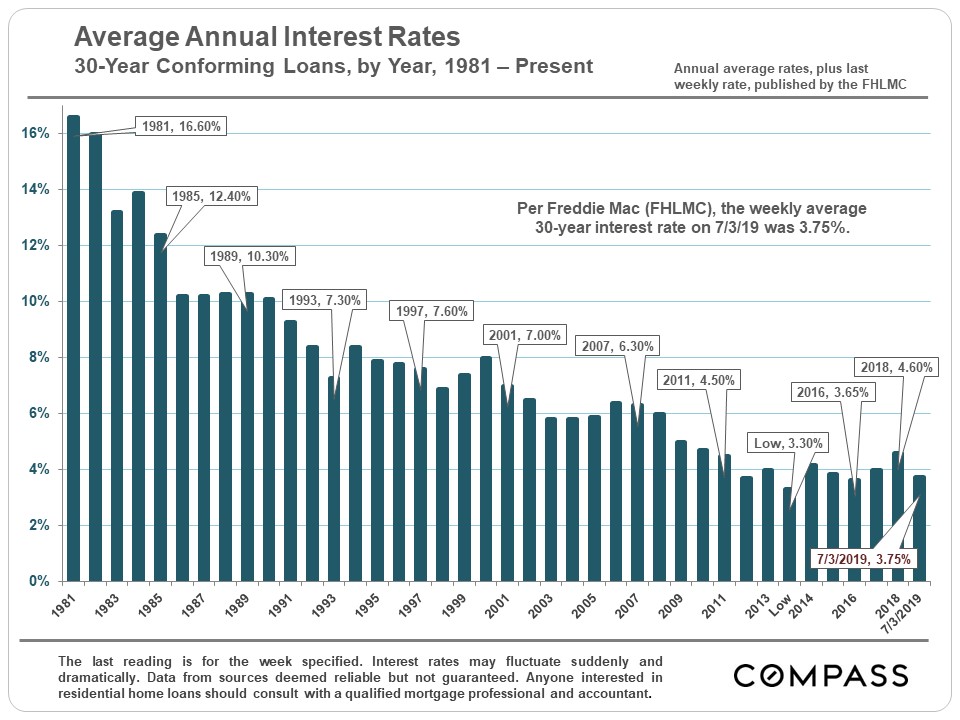
Mortgage Interest Rate Trends since 1981
A huge drop since late 2018 brings mortgage rates much closer to historic lows.

Jeff Salgado
DRE#: 01501886
415.915.9916
jeff(at)jeffsalgado(dotted)com
© Compass 2018 ¦ All Rights Reserved by Compass ¦ Made in NYC
Compass is a licensed real estate broker (01991628) in the State of California and abides by Equal Housing Opportunity laws. All material presented herein is intended for informational purposes only. Information is compiled from sources deemed reliable but is subject to errors, omissions, changes in price, condition, sale, or withdraw without notice. No statement is made as to accuracy of any description. All measurements and square footages are approximate. Exact dimensions can be obtained by retaining the services of an architect or engineer. This is not intended to solicit property already listed