
![]()

Mixed Signals in San Francisco Real Estate Market
Sometimes Contradictory Sales and Inventory
Indicators in City & Across Bay Area
November 2018
Autumn markets in counties around the Bay Area have seen significant shifts, with wide variance in the magnitude of these changes between counties. So far, San Francisco itself has seen less dramatic changes than other local markets such as Santa Clara and Sonoma Counties.
Homes that sell have generally continued to sell quickly, at prices often well over asking. Median sales prices are considerably higher on a year-over-year basis. However, listing inventory has climbed, sales volume has dropped, and the numbers of price reductions and expired listings have increased. Luxury house sales hit a new all-time high in San Francisco. Luxury condos hit a new sales peak for the month of October, but the number of listings hit a new all-time high.
Market statistics are generating contradictory readings amid a background of financial market and political volatility, and rising interest rates. Some standard statistics take time to reflect changes on the ground, and will bear watching in coming months.
Median Sales Price Appreciation
4 Views
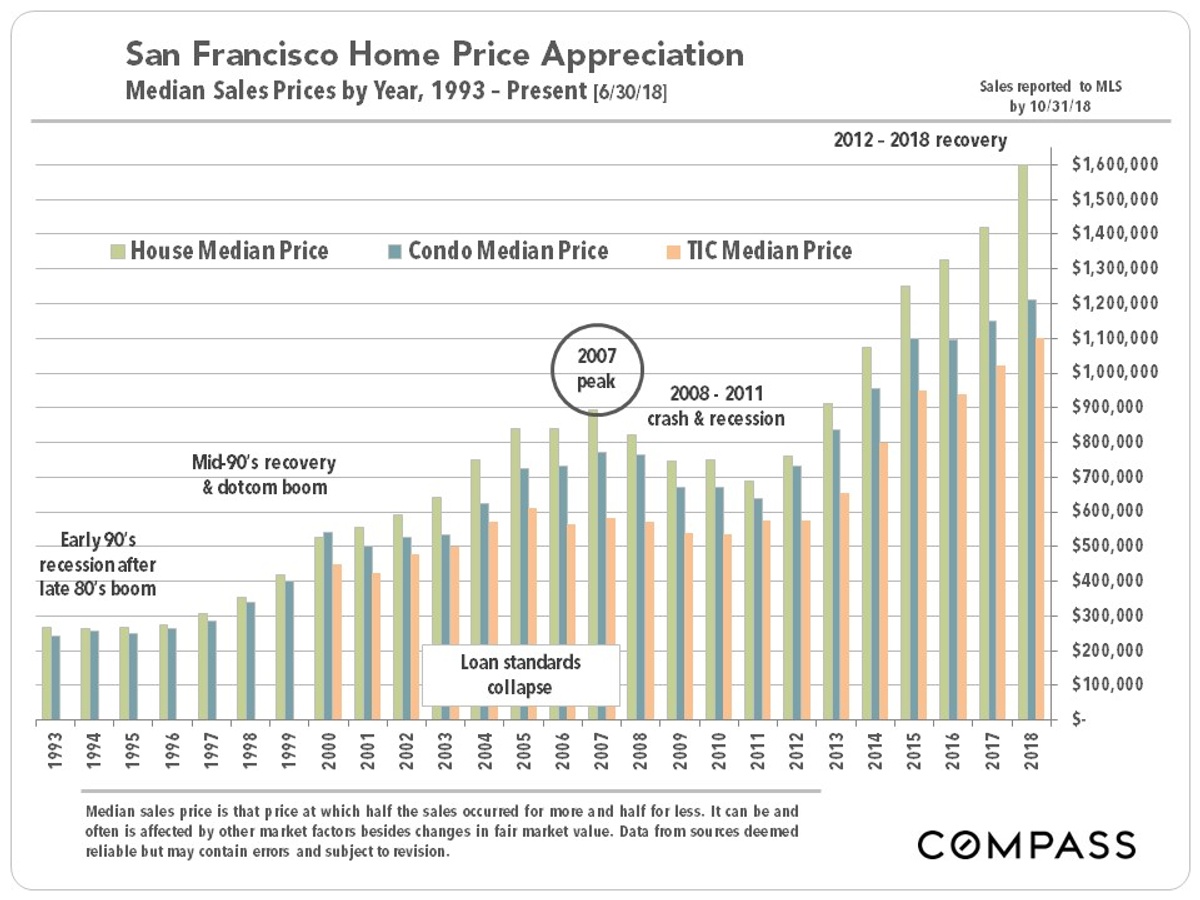
Long-Term Annual Trends since 1993
(2018 figure reflects YTD sales)
In recent years, house price appreciation has
far outpaced that of condos.
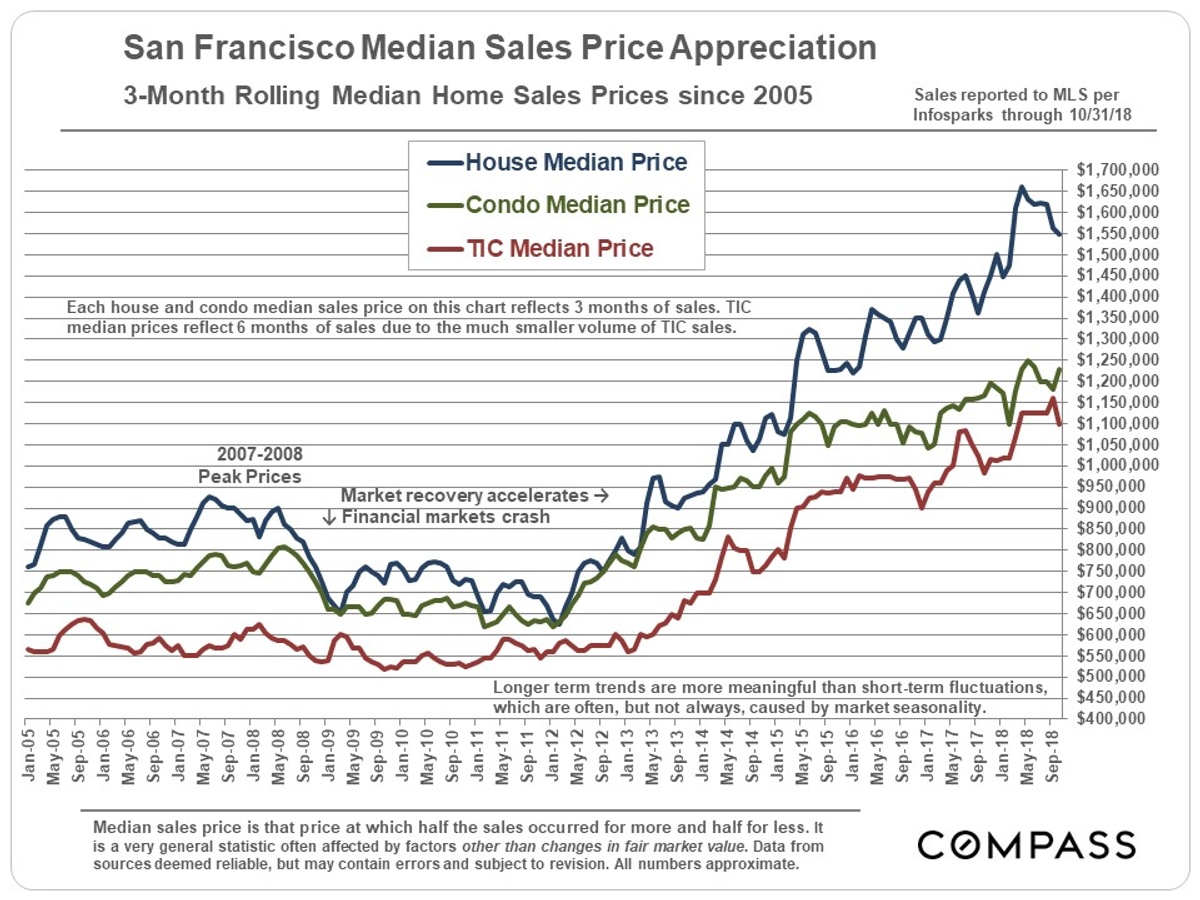
3-Month Rolling Median Price Trends since 2005
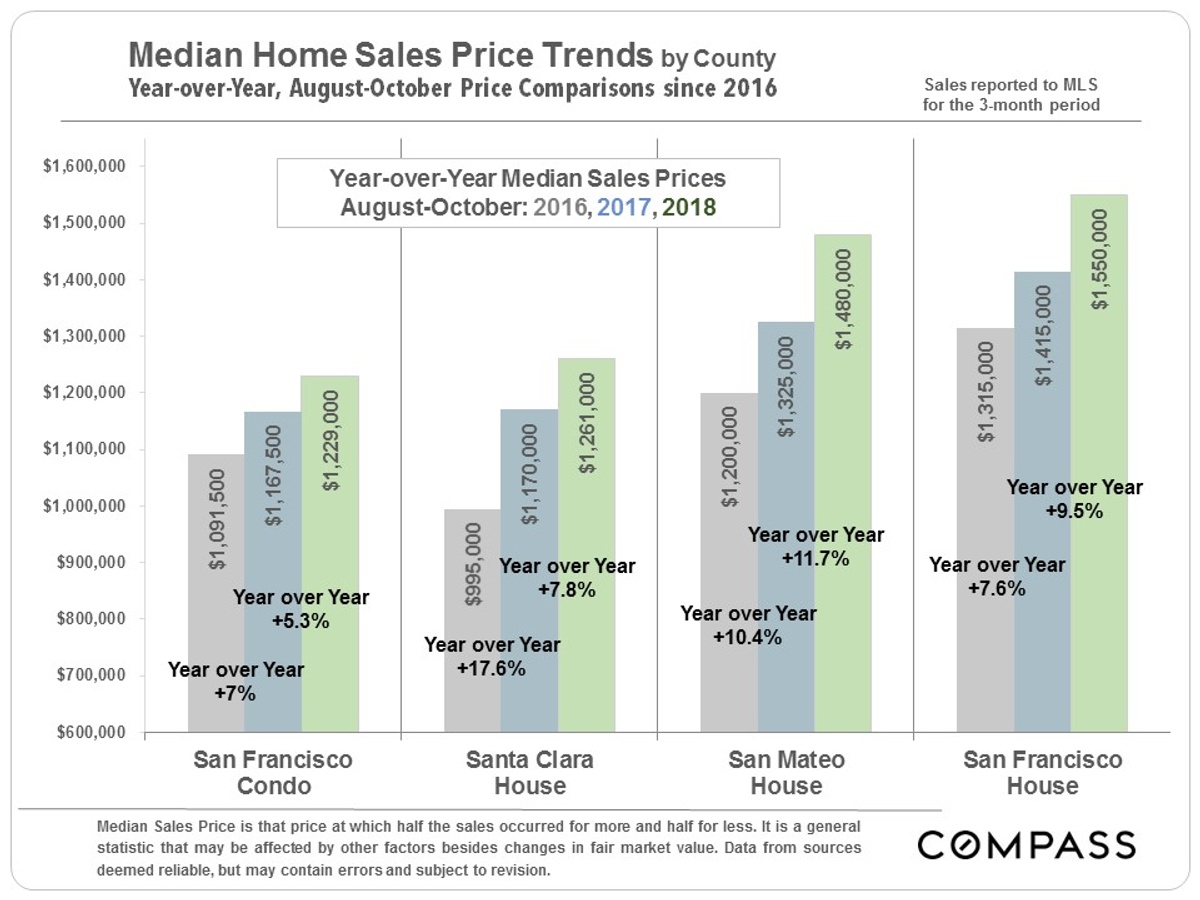
Year-over-Year Comparisons, 2016-2018:
San Francisco, San Mateo, Santa Clara Counties
Appreciation percentages can change rapidly
in these year-over-year comparisons.
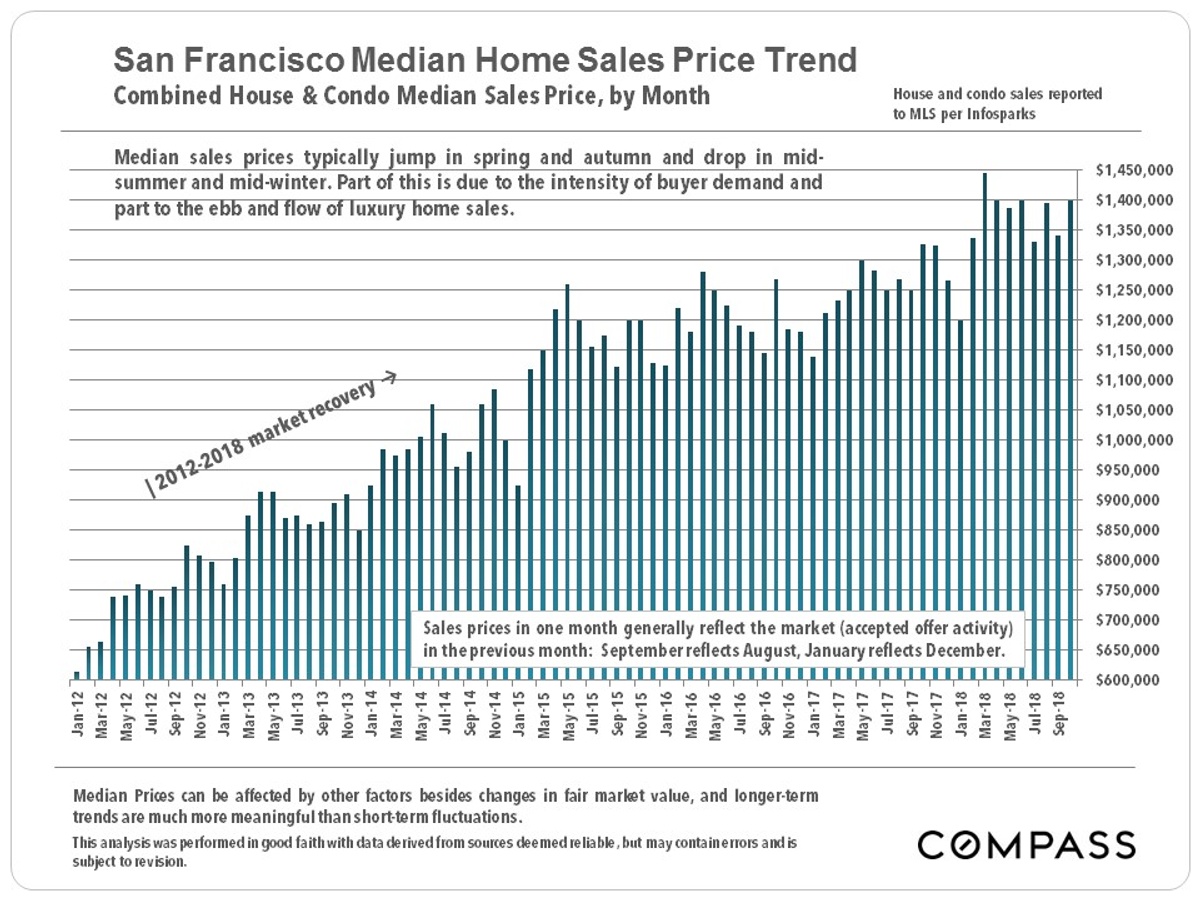
Monthly Median Price Changes since 2012
COMBINED House and Condo Median Sales Prices
Monthly and seasonal fluctuations are very common.
Supply & Demand Statistics
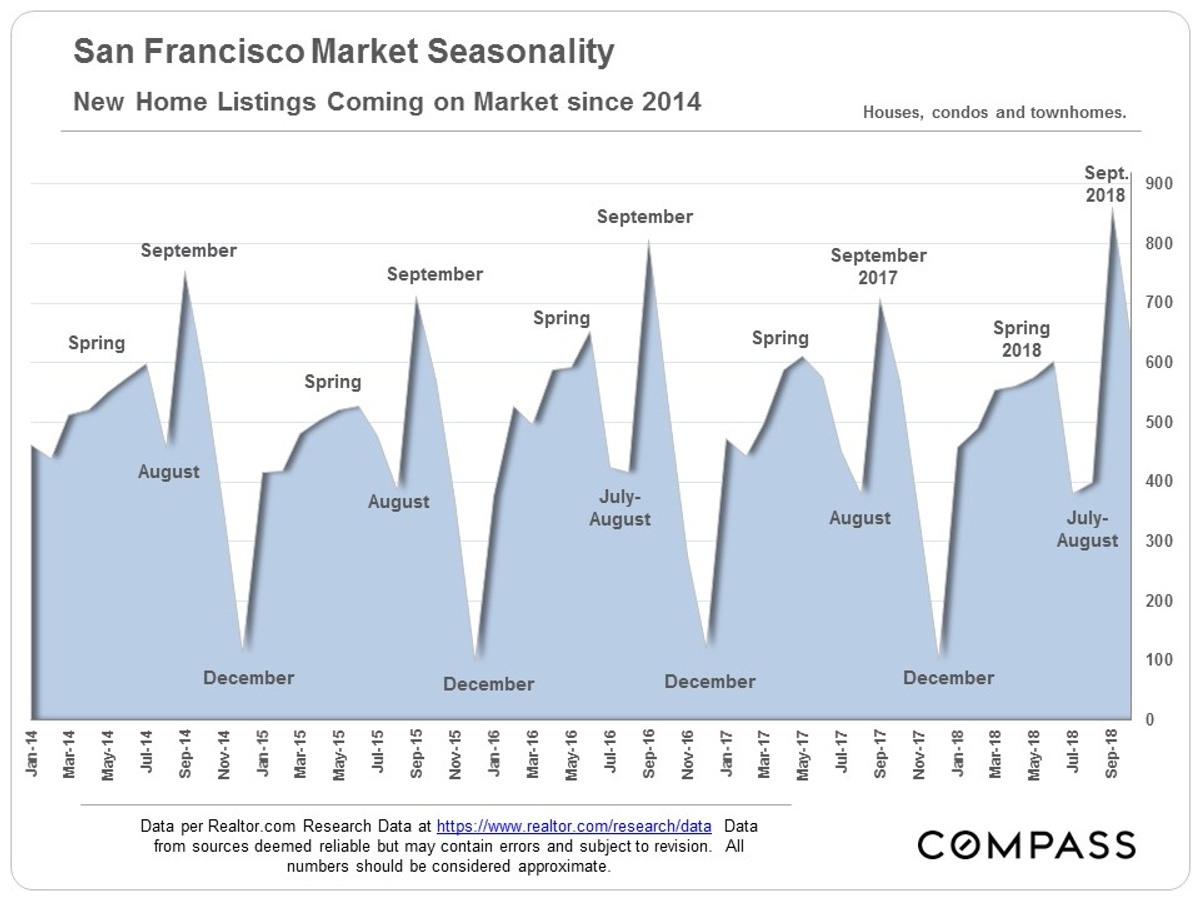
More new listings came on market in autumn 2018, providing buyers with more choices and lessening the sense of urgency and competitive bidding.
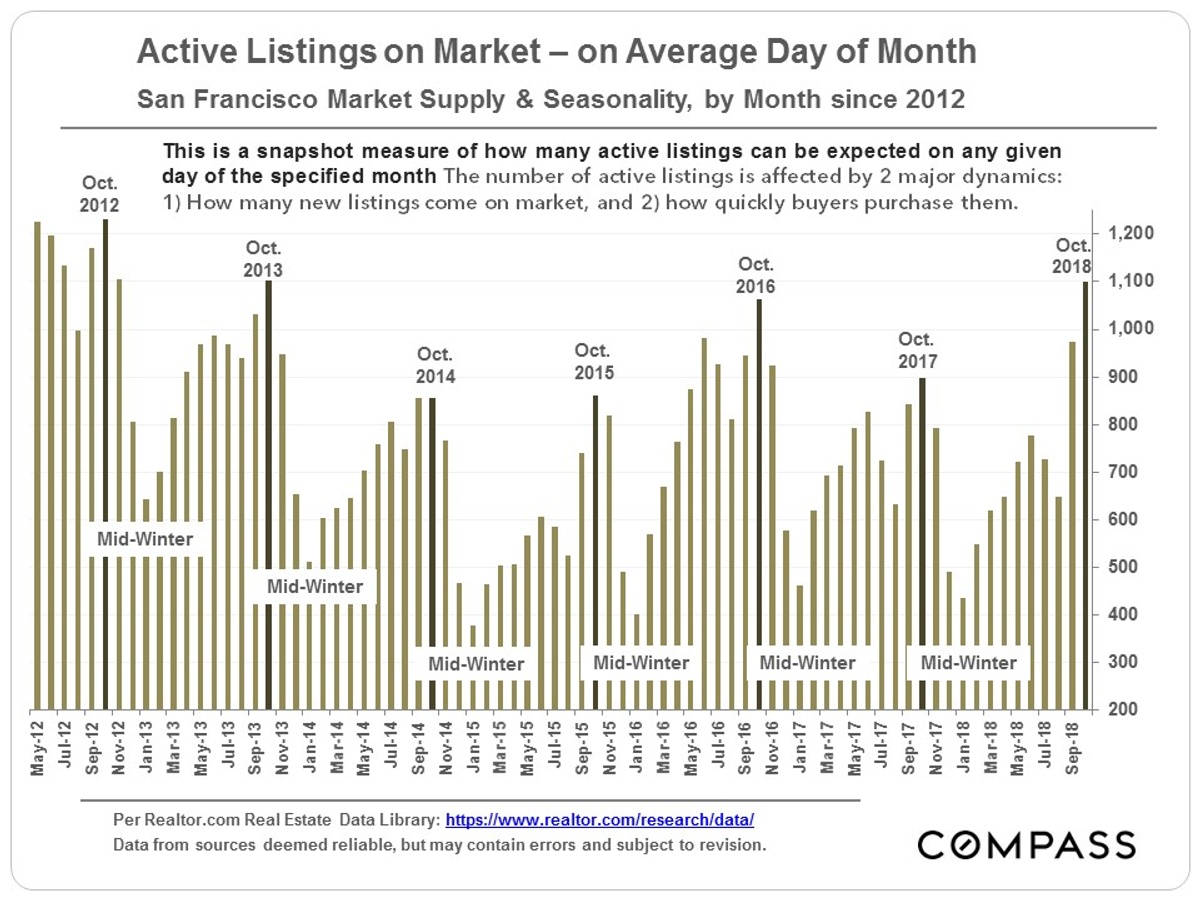
The number of active listings on the market is significantly higher than in October 2017, 2015 or 2014, but comparable to October 2016 and 2013. Further increases might considerably alter the supply and demand dynamic.
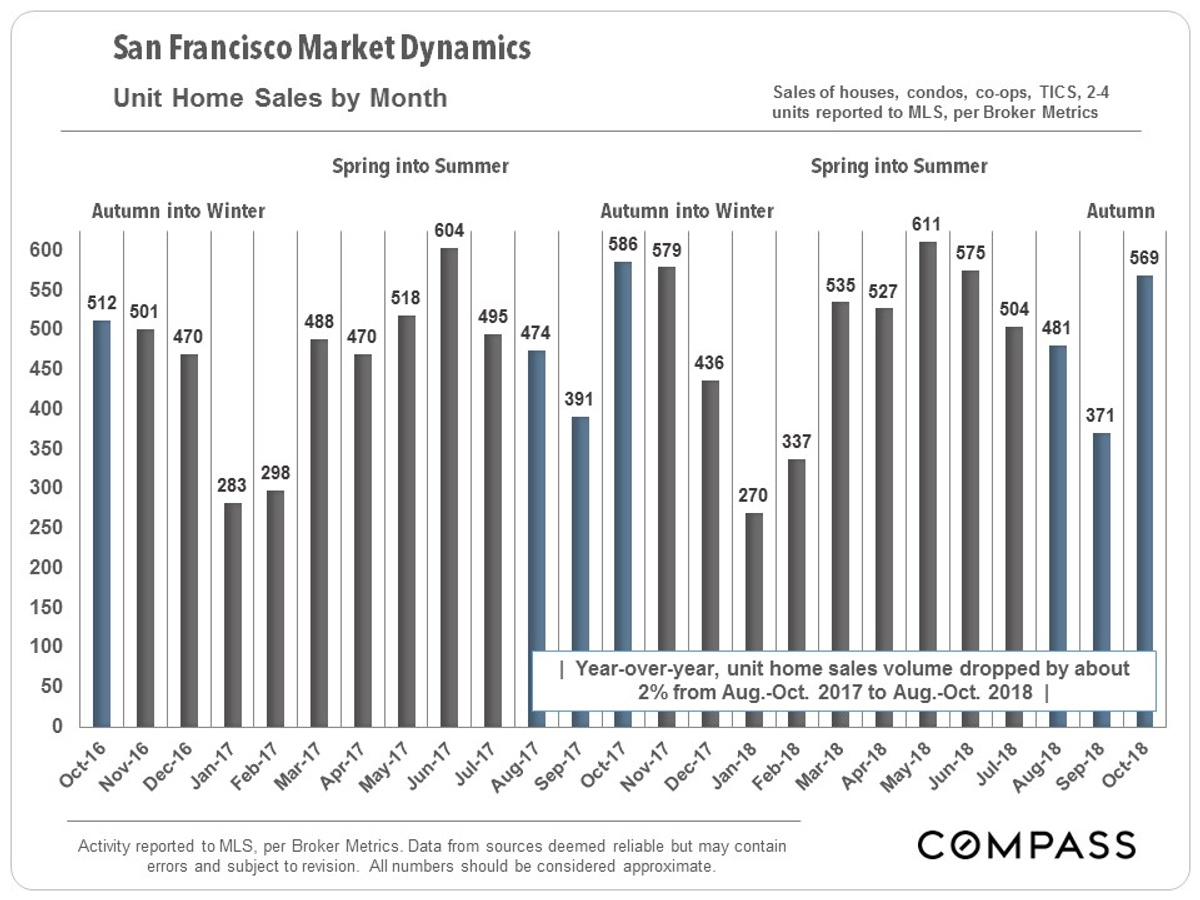
Looking at the past 3 months, sales volume has dropped about 2% year over year. September 2018 saw the lowest volume of any September in 10 years, but then September is not typically a high volume month: It mostly reflects accepted-offer activity in August when the market slows way down.
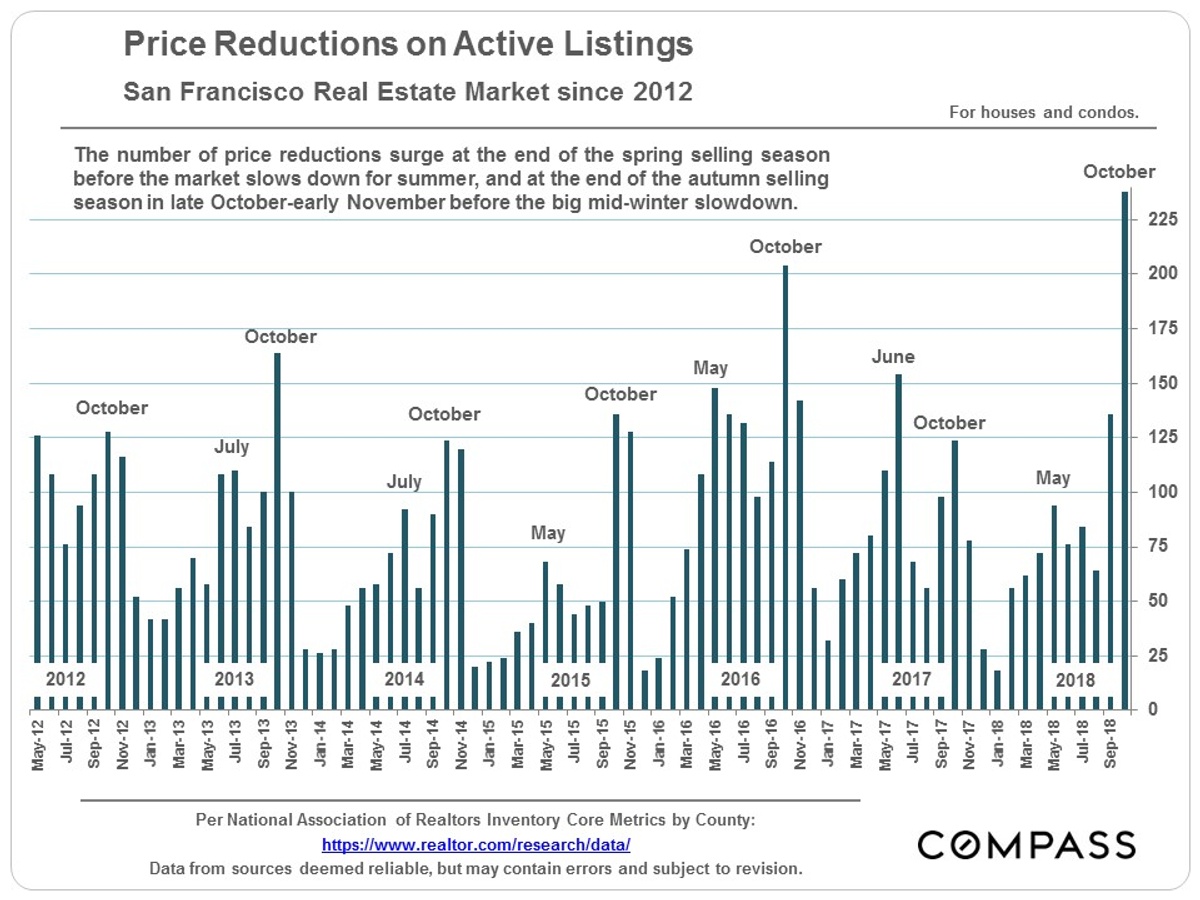
October 2018 saw the highest number of price reductions in 6 years. Some other counties saw much more dramatic increases. This is an important indicator of changing market conditions.
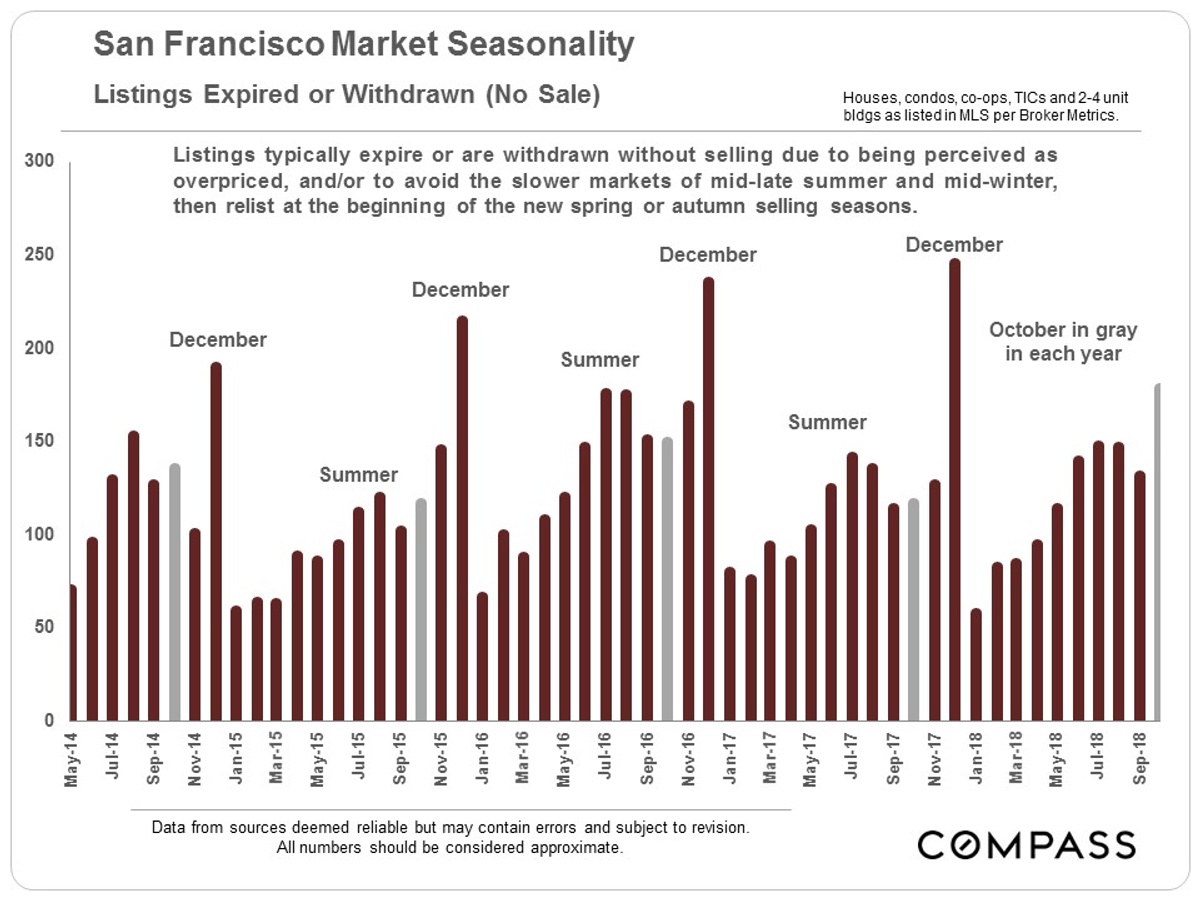
The number of expired and withdrawn listings – no sale – started to climb in October 2018 above previous years. December is the big month for listings being pulled off the market for the mid-winter holiday slowdown. This statistic will bear watching to see if there is a big jump in homes that sellers have not been able to sell at prices they consider acceptable.
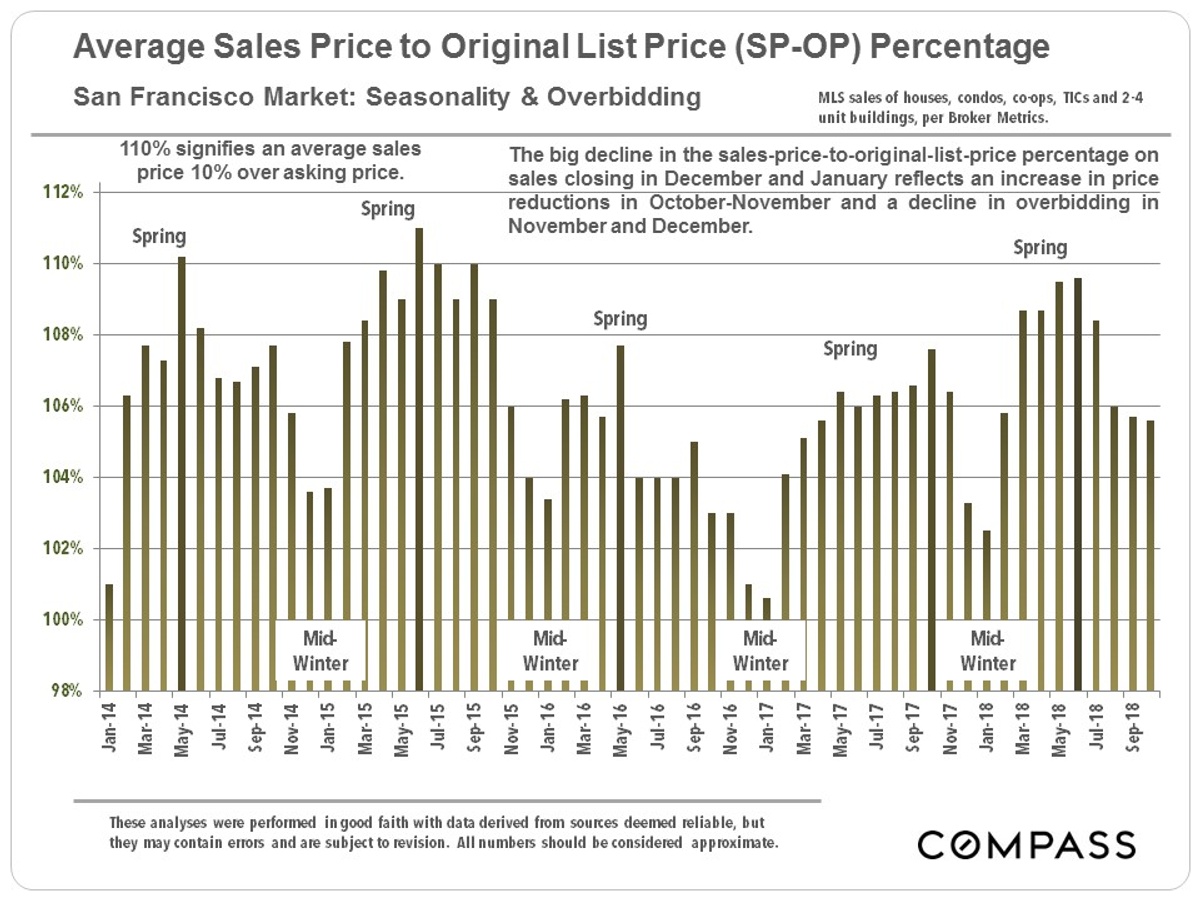
Average percentage of sales price to original list price (overbidding) declined from the heat of the spring selling season, as is typical, was lower than in October 2017, 2015 or 2014, but higher than in October 2016.
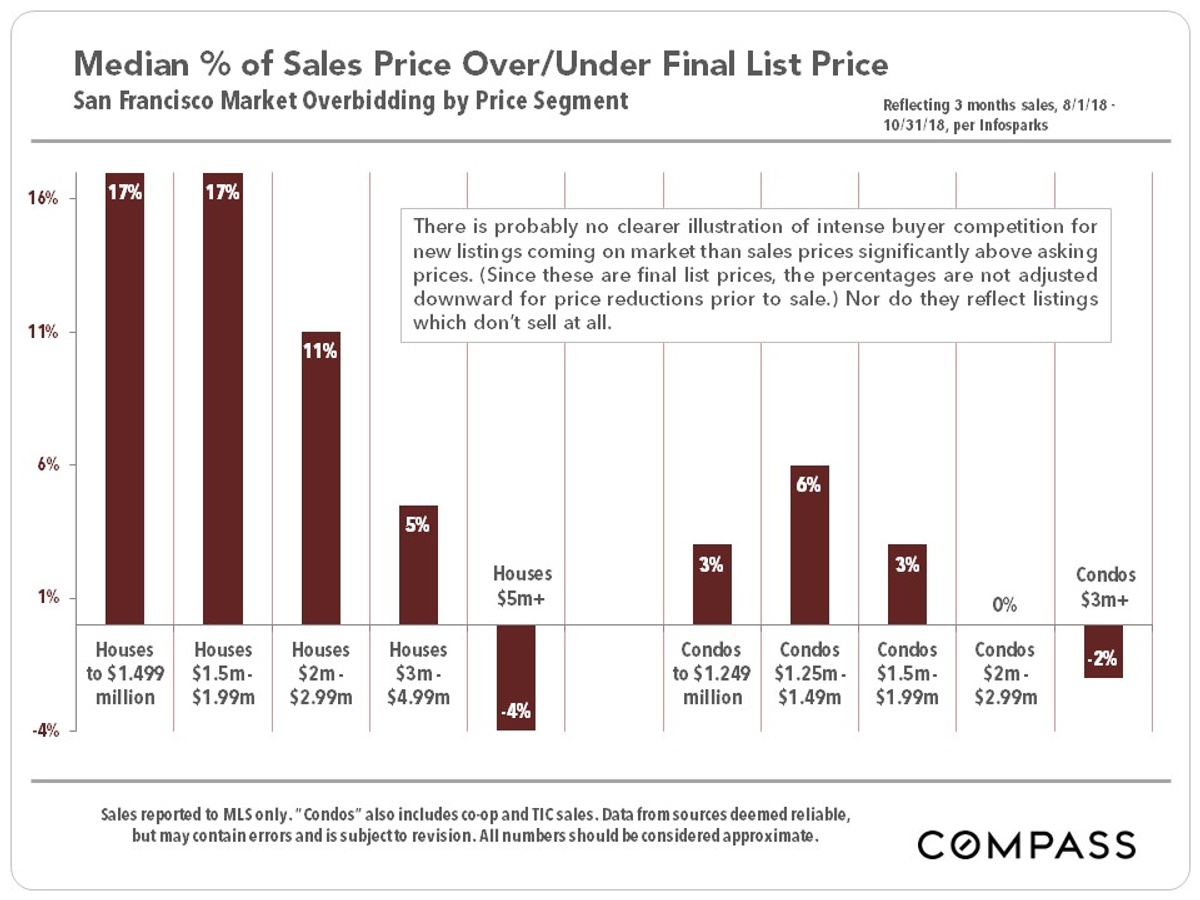
Looking at the past 3 months of median sales price to final list price percentages, overbidding varied greatly by property type and by price segment, and some rates remain staggeringly high. But the increased number of listings undergoing price reductions this autumn has generally not yet had time to sell and thus be reflected in these statistics – when they do, if they do, they may well lower the rates seen in the charts above and below.
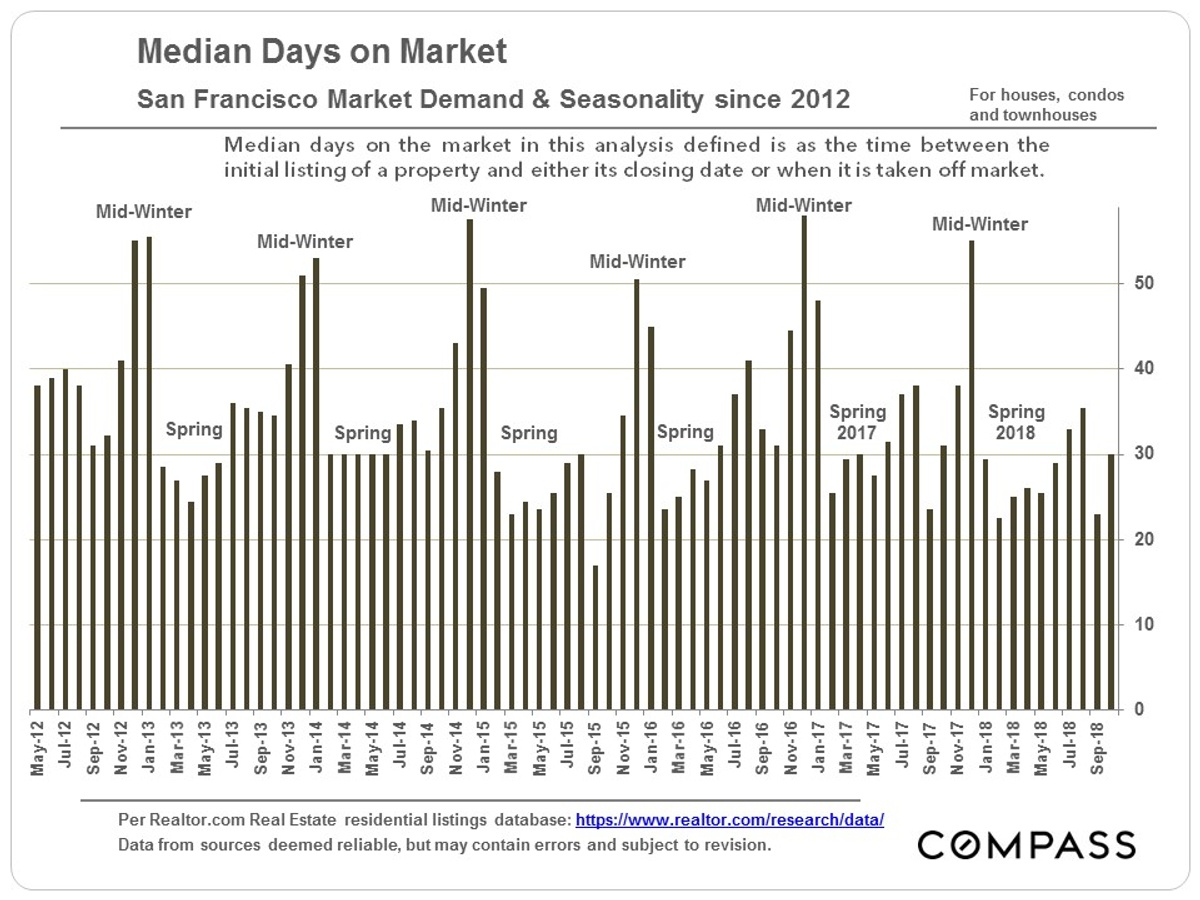
So far, those listings selling this autumn have generally sold relatively quickly. But this statistic won’t reflect properties that have not yet sold, perhaps after necessary price reductions. If the market is in the midst of a sustained transition, future months may see significant adjustments in this metric.
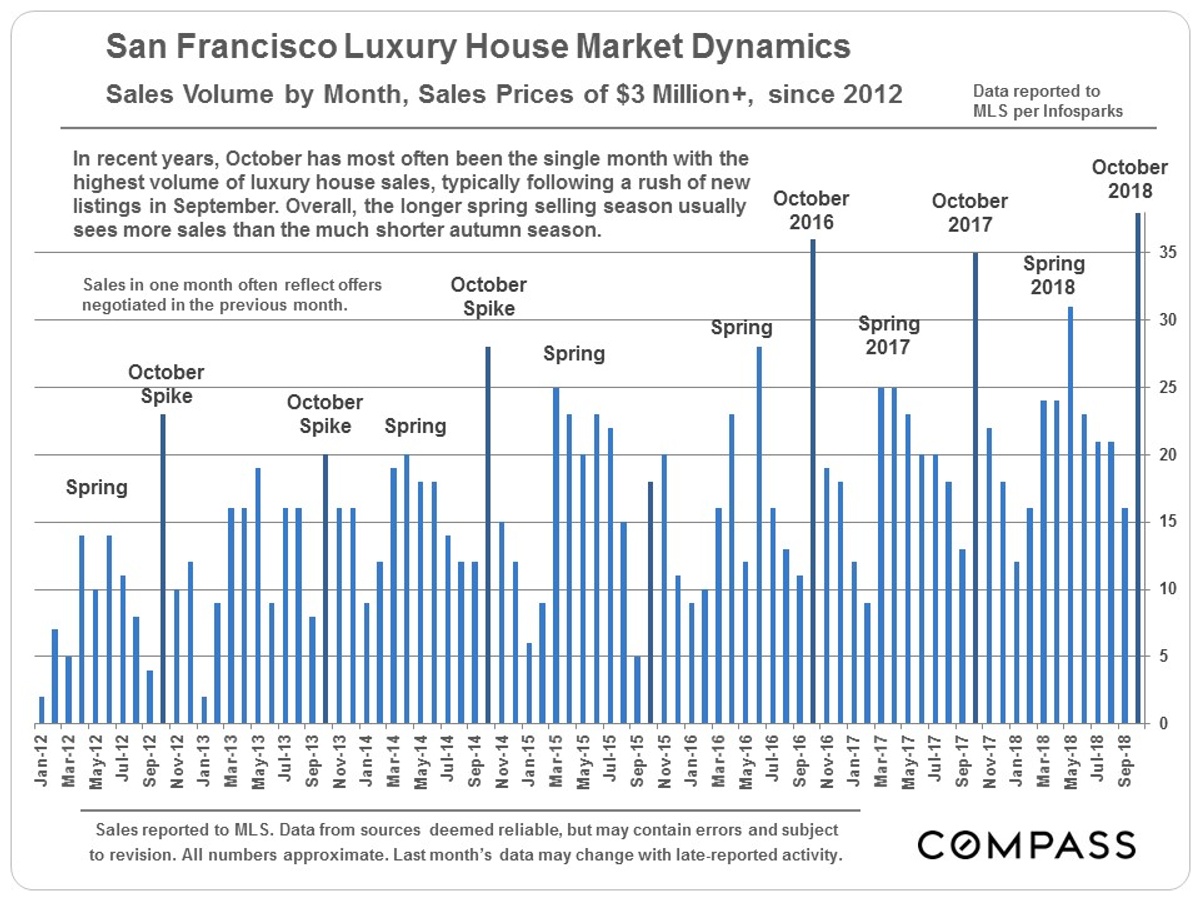
Luxury Home Sales Hit New Highs
Houses selling for $3 million and above hit an all-time high – by a tad at 38 sales – in October 2018, as reported to MLS. The great majority of these sales occurred in 2 districts, the Noe, Eureka and Cole Valley district, and the Pacific & Presidio Heights-Marina district – though smaller numbers of sales took place in a wide variety of other neighborhoods. The highest-price sales were for $32 million in Pacific Heights and $16 million in Nob Hill. There were 4.5 months of inventory at the end of October, not a particularly high level of inventory for this market segment, and down 15% from October 2017.
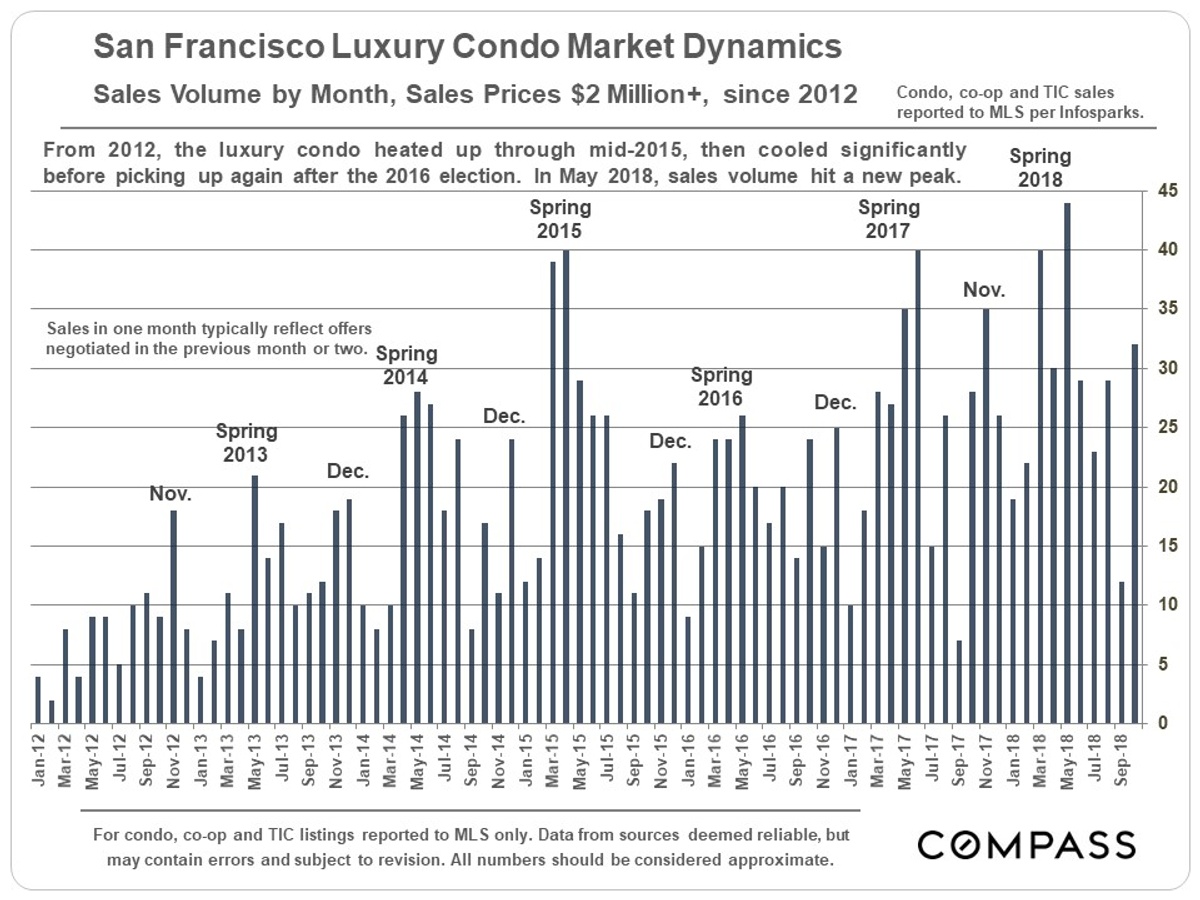
Luxury condos, co-ops and TICs selling for $2 million+ hit their highest point ever for the month of October – 32 sales – but were well below highs hit in previous spring selling seasons. The highest sale in October, as reported to MLS, was for $10.9 million – a 3200 sq.ft. unit in the St. Regis in Yerba Buena. However, the number of active listings also hit an all-time high in September (144) and October (141) – 11% higher than October 2017, the previous peak (not illustrated on the sales chart below). The months supply of inventory stood at 6.5 months, which would be considered high as compared to the last 5 years – and does not include many new-project luxury condos not listed in MLS.
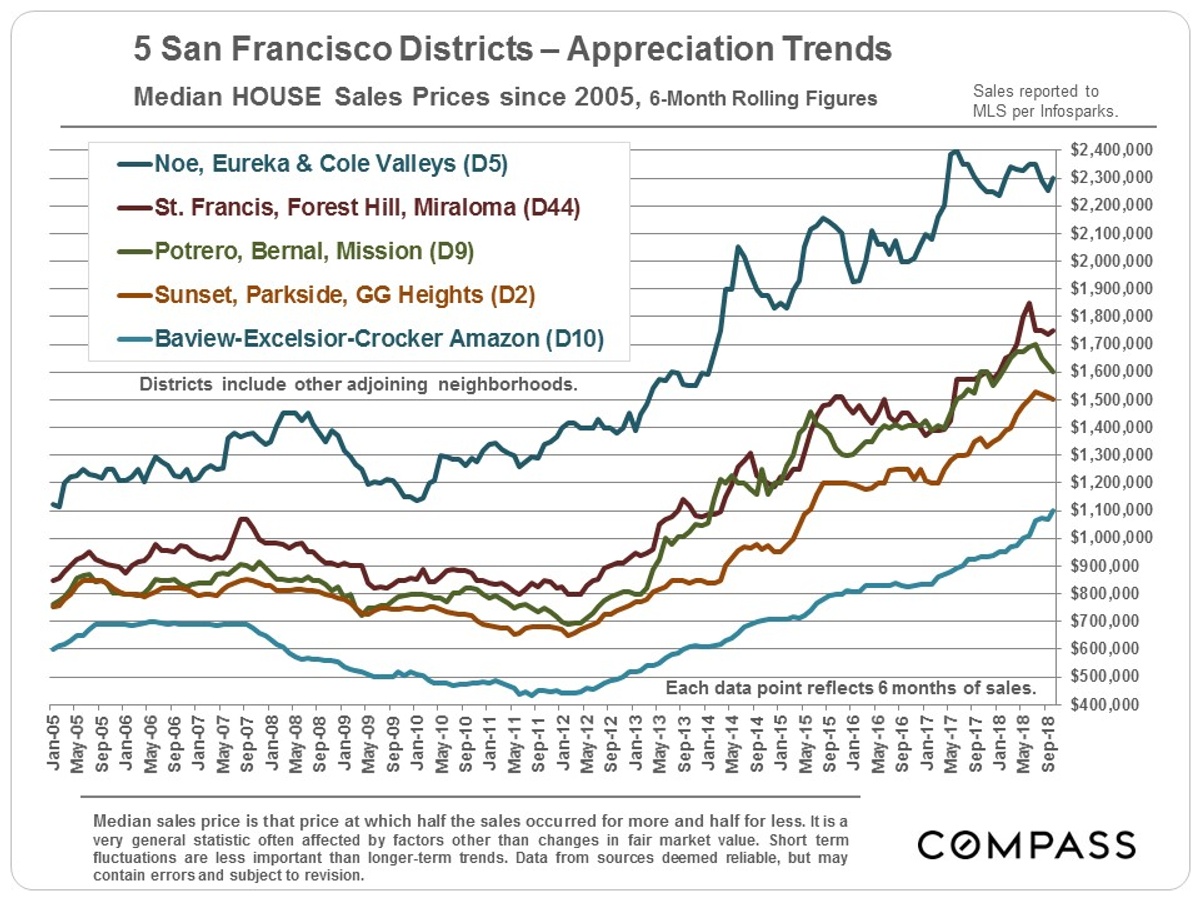
SF District Median Sales Price Appreciation
since 2005
San Francisco Houses
Short-term fluctuations are not particularly meaningful as pertaining to changes in fair market values – and big fluctuations are more common in more expensive areas. What are important are the longer term trends.
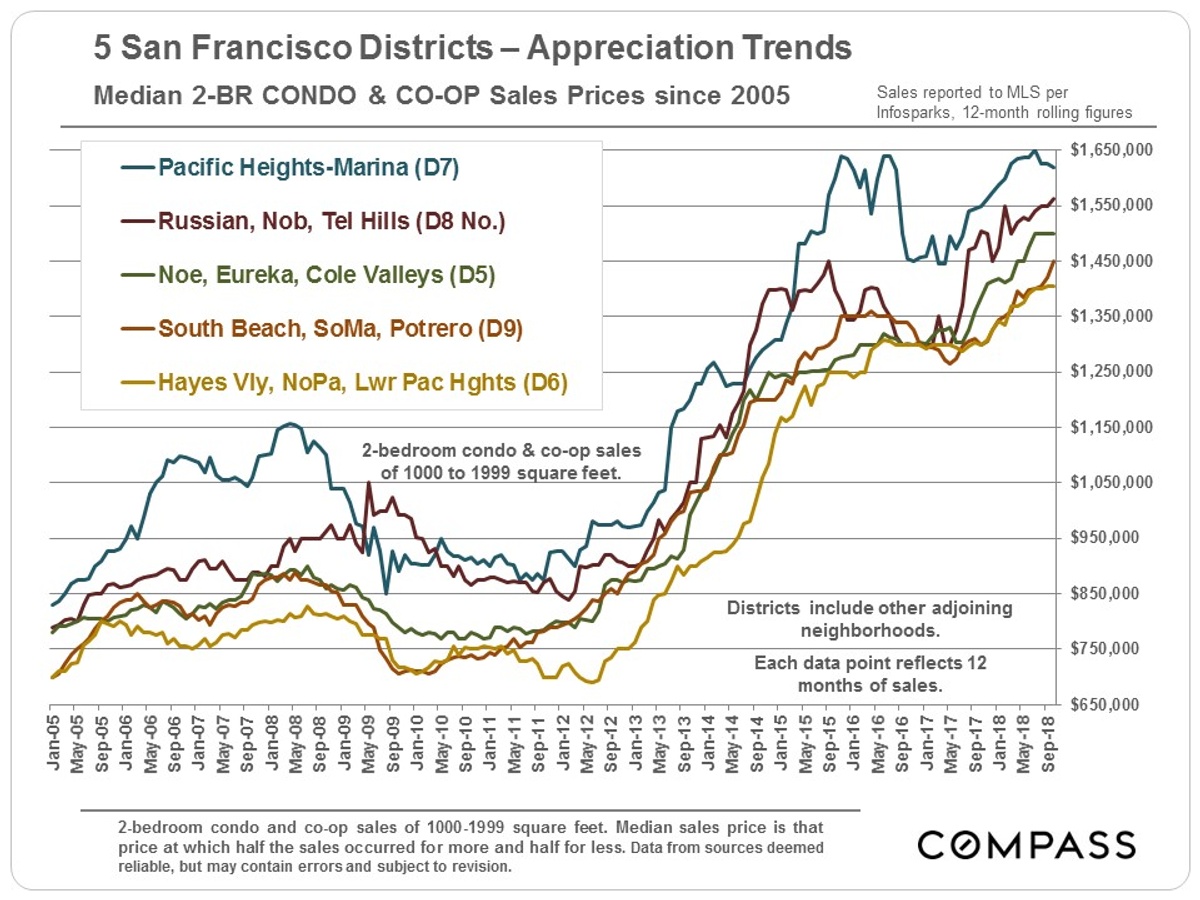
San Francisco 2-Bedroom Condos & Co-ops
New condo construction can muddy the water of apples-to-apples comparisons of median condo sales prices over time, but the the general trends are still relatively clear.
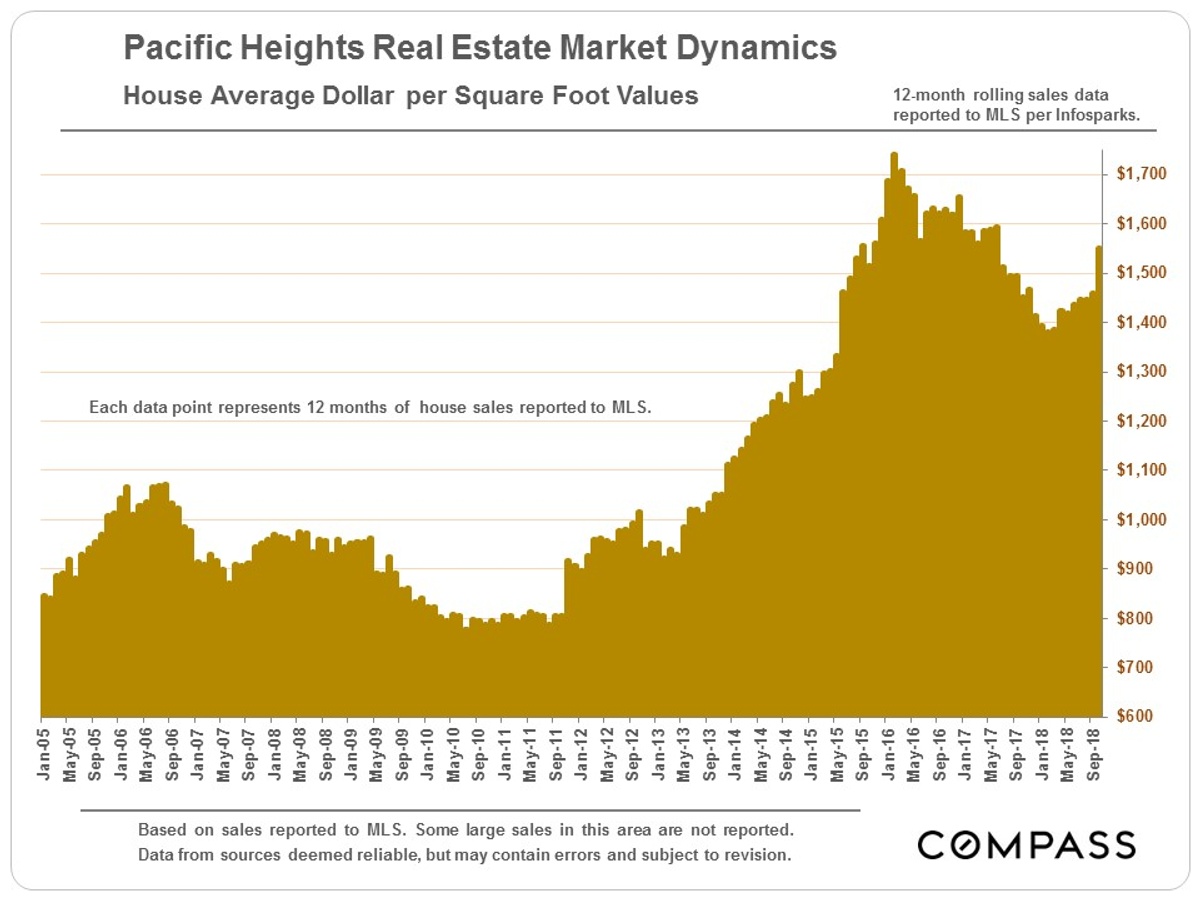
In Pacific Heights, a neighborhood of big, very expensive houses, both median sales prices and average dollar per square foot values (illustrated below) have dropped from peaks hit in 2015-2016.
Patrick Carlisle
patrick(dotted)carlisle(at)compass(dotted)com© Compass 2018 ¦ All Rights Reserved by Compass ¦ Made in NYC
Compass is a licensed real estate broker (01991628) in the State of California and abides by Equal Housing Opportunity laws. All material presented herein is intended for informational purposes only. Information is compiled from sources deemed reliable but is subject to errors, omissions, changes in price, condition, sale, or withdraw without notice. No statement is made as to accuracy of any description. All measurements and square footages are approximate. Exact dimensions can be obtained by retaining the services of an architect or engineer. This is not intended to solicit property already listed