
![]()

869976984
San Francisco Real Estate
November 2019 Report
————
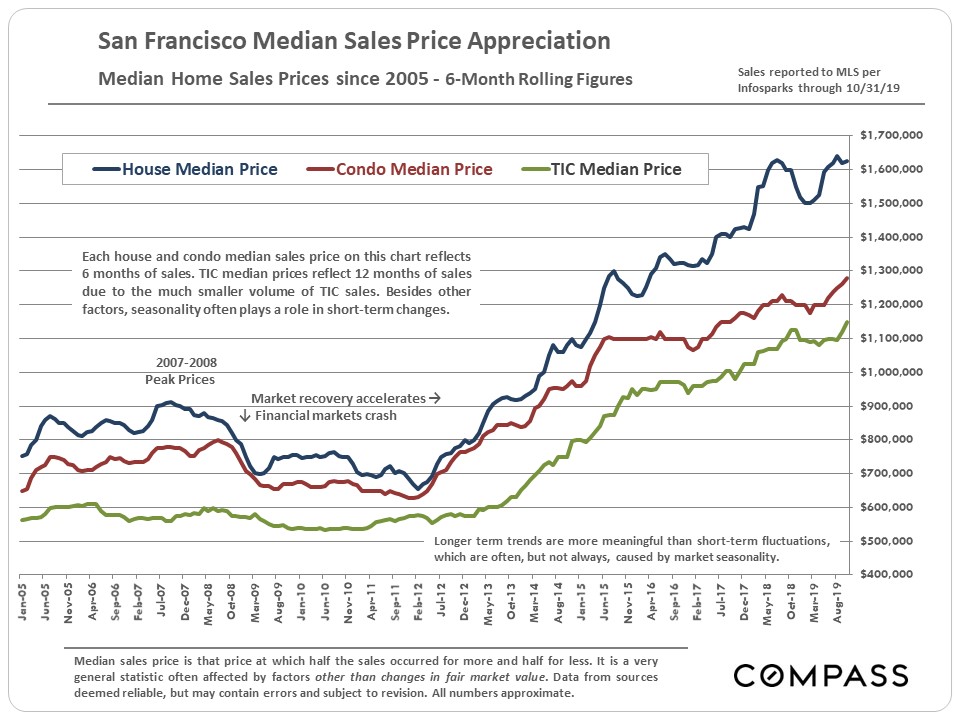
Median Home Price Trends since 2005
Using six-month-rolling figures for monthly median sales prices smooths out the often meaningless monthly fluctuations to illustrate broad, long-term appreciation trends with more clarity.
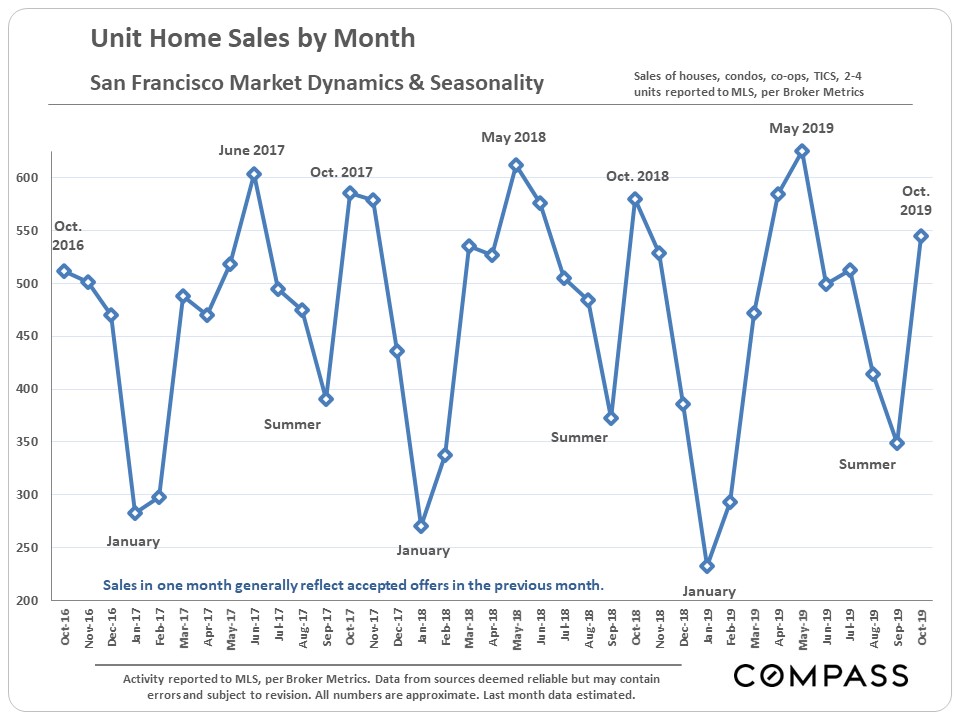
Home Sales Volume by Month
A crystal clear illustration of the role of seasonality in the SF real estate market. Starting in November activity begins to plunge towards the mid-winter nadir. Remember that November sales volumes mostly reflect October accepted-offer activity. Market activity hits bottom in December, which makes January the month with the lowest sales volume.
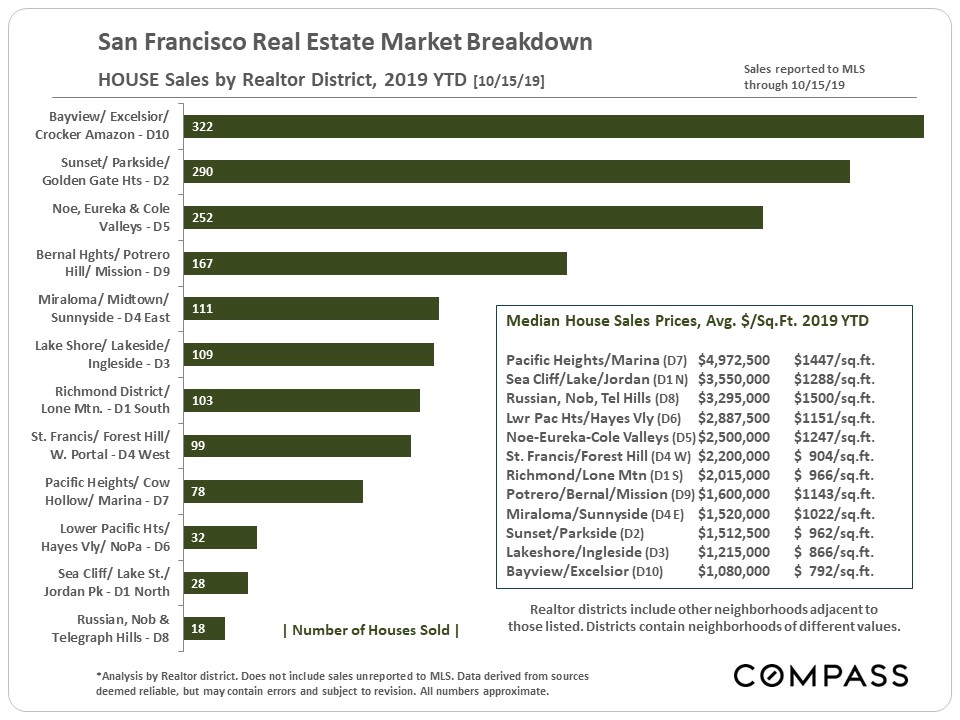
Home Sales & Median Prices by District
HOUSE Sales & Median Sales Prices
Note that districts often include neighborhoods of varying values and that the district median sales prices quoted reflect combined sales. Median prices are broad generalities useful for comparative values and home-price trends, but how they apply to any particular home is unknown without a specific comparative market analysis.
Median sales prices broken out by neighborhood, property type and bedroom count are also available upon request.

Condo, Co-op & TIC Sales by District
2-BR, 2-BA Condo Median Sales Prices
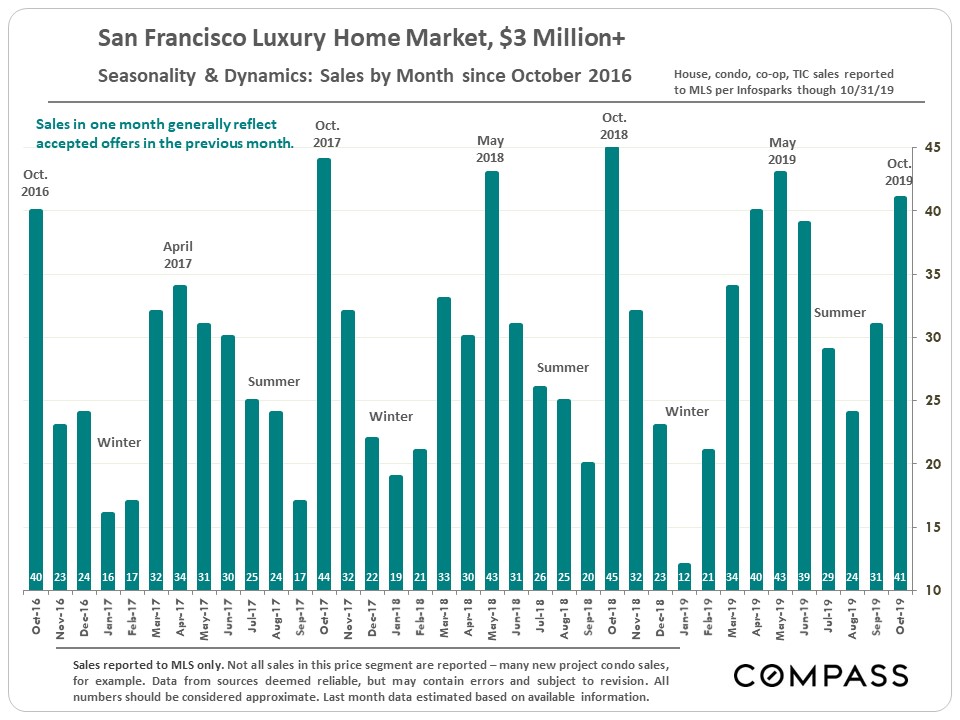
Luxury Home Sales
Sales of homes of $3 million and above in October were a little below the number in October 2018, but looking at September-October sales, there were gains over same-period sales in 2016, 2017 and 2018.
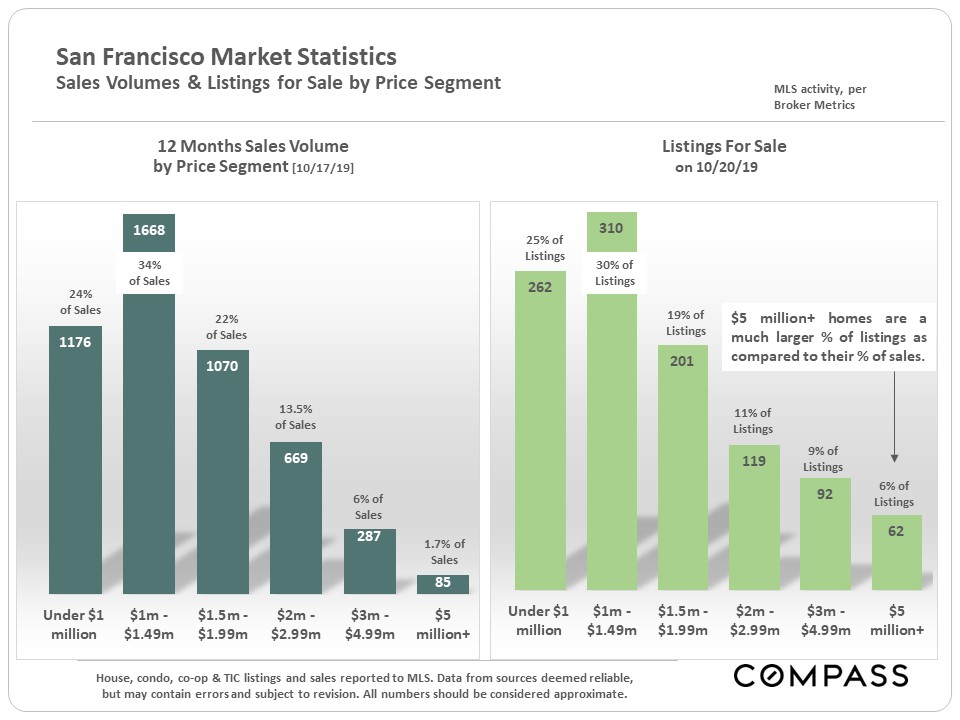
Sales vs. Listings for Sale by Price Segment
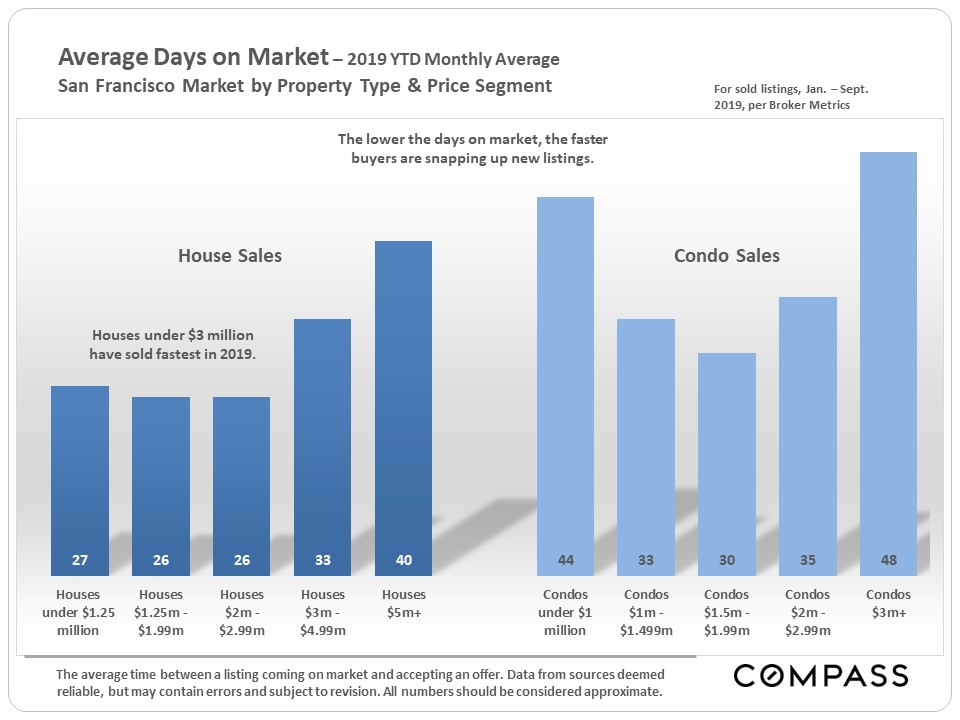
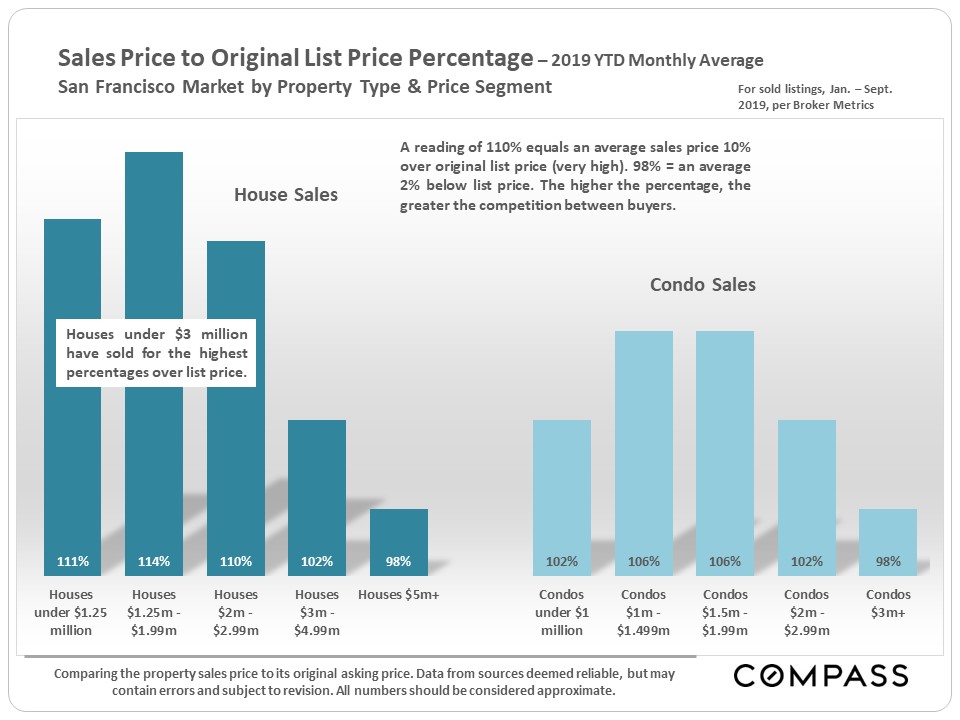
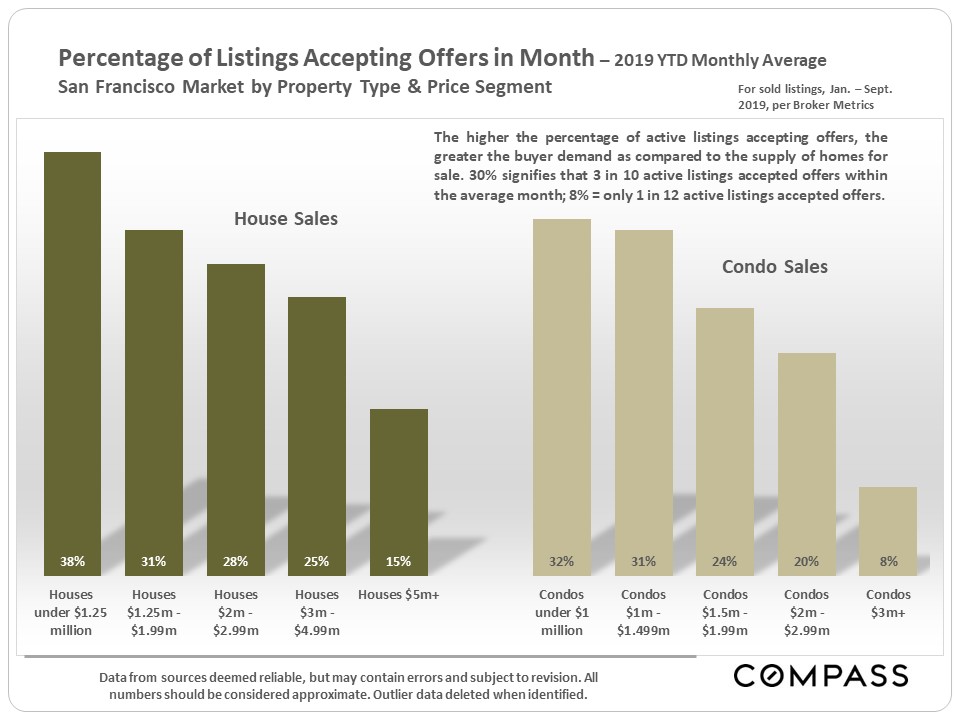
Market Dynamics by Property Type
& Price Segment
Location is, of course, always important in real estate value – within the the city and within the neighborhood – but to a large degree, market dynamics within San Francisco are also determined by the property type and the price segment. And individual neighborhoods and districts will usually have homes in several or even all of the price segments broken out in the 3 charts below, with these segments seeing differing supply and demand conditions.
Generally speaking, demand is stronger and supply is lower (as compared to demand) for houses over condos. For both houses and condos, market dynamics are somewhat softer in the higher price segments, especially above the $3 million price threshold for condos, and in the $5 million+ price segment for houses.
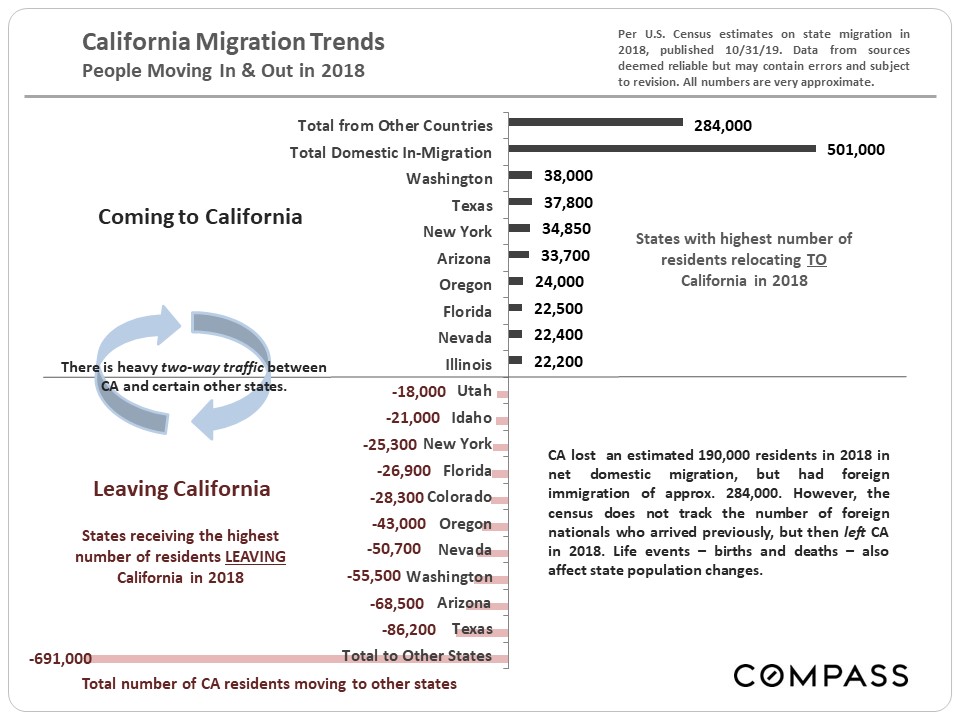
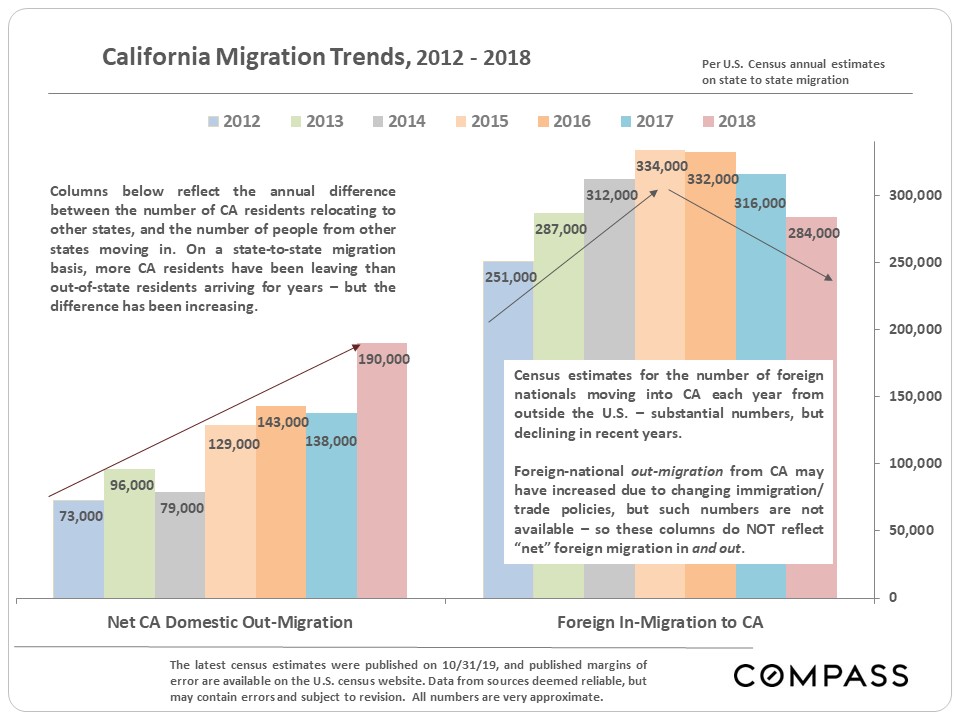
People Moving in & out of CA in 2018
According to new census estimates, approx. 501,000 people from other states moved to CA in 2018, while 691,000 Californians relocated to other states – a net loss of 190,000. In addition, an estimated 284,000 foreign nationals moved into CA from outside the country. (Foreign out-migration numbers are not available.)
The top states for out-migration are Texas, Arizona, Washington, Nevada & Oregon, states with high-tech centers of their own and/or no state income taxes, and/or significantly lower housing costs – thus attracting working residents, local businesses, and retirees. Updated Bay Area figures are not yet available, though migration trends here have generally paralleled state trends in recent years.
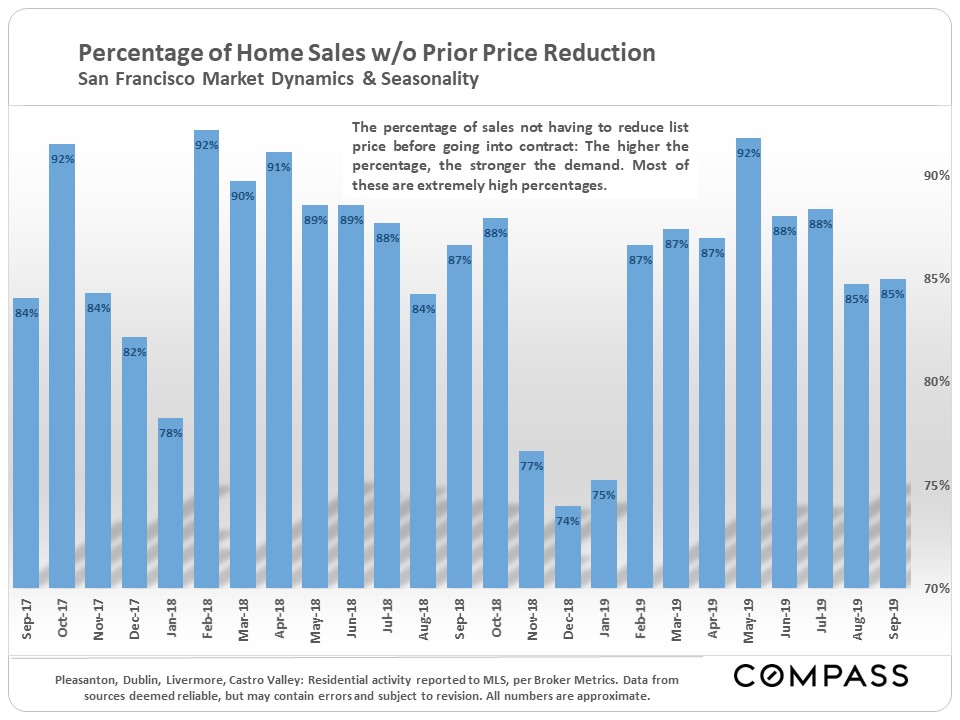
Sales Without Price Reductions
& Withdrawn (No-Sale) Listings
The following 2 charts illustrate both year-over-year changes in market conditions and the role of seasonality within the calendar year.
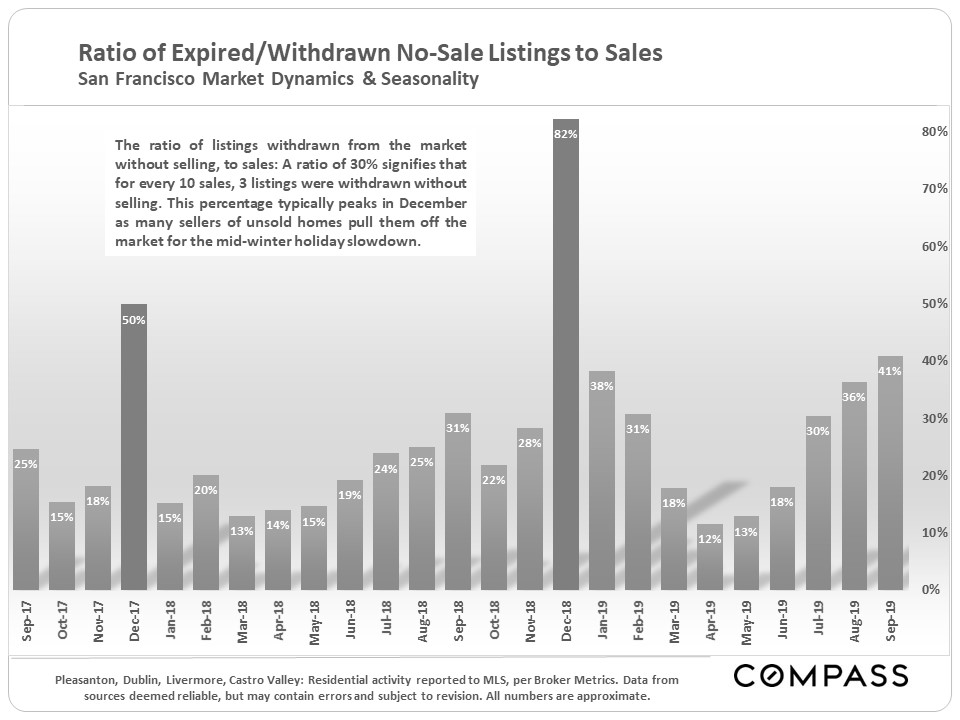
Last year saw a big jump in the number of listings pulled off the market without selling in December – this was a particularly volatile time in financial markets and interest rates were relatively high. The situation with both of those factors has changed dramatically in 2019, but it is too early to see how that will affect the number of listings withdrawn in the last 2 months of this year.

Jeff Salgado
DRE#: 01501886
415.915.9916
jeff(at)jeffsalgado(dotted)com
© Compass 2019 ¦ All Rights Reserved by Compass ¦ Made in NYC
Compass is a real estate broker licensed by the State of California operating under
multiple entities. License Numbers 01991628, 1527235, 1527365, 1356742, 1443761, 1997075,
1935359, 1961027, 1842987, 1869607, 1866771, 1527205, 1079009, 1272467. All material presented
herein is intended for informational purposes only and is compiled from sources deemed reliable
but has not been verified. Changes in price, condition, sale or withdrawal may be made without
notice. No statement is made as to accuracy of any description. All measurements and square
footage are approximate. Equal Housing Opportunity.