
![]()

San Francisco Real Estate
Updated Market & Census Statistics, Home Prices & Appreciation Rates, Luxury Home Sales, Price Reductions, Employment & Interest Rates
October 2019 Report
It will be another month before hard data on the autumn selling season begins to become available. In the meantime, below is a review of market trends and statistics through the third quarter. Note that September sales data mostly reflects market activity in August, a historically slow month.
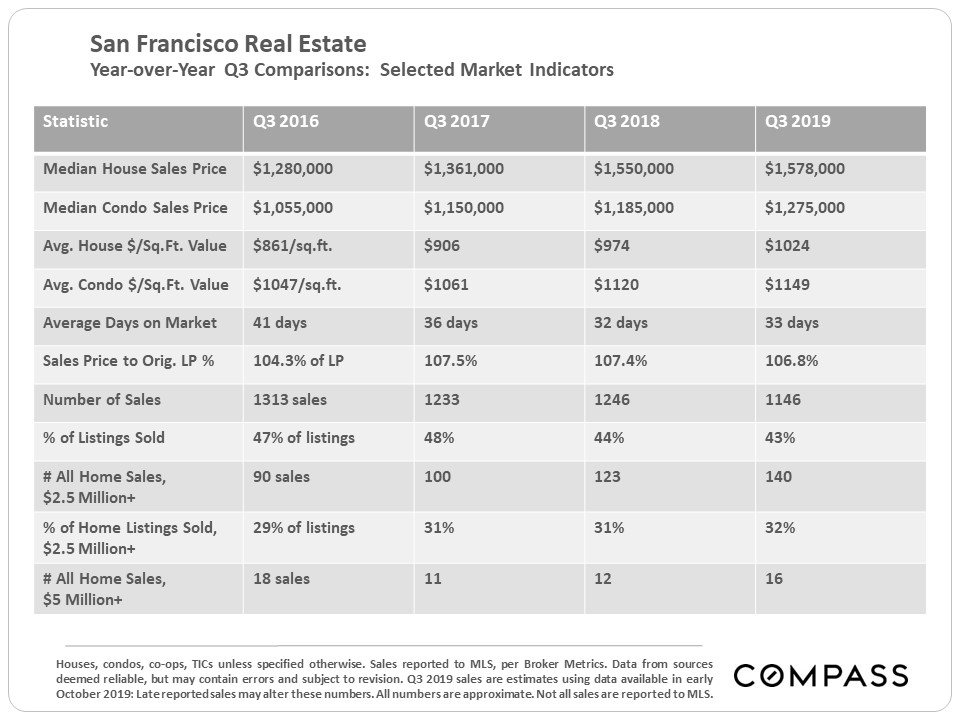
Year-over-Year Q3 Comparisons –
Q3 2016 – Q3 2019
Looking back over the Q3 statistics in the past 4 years, the San Francisco market has remained quite strong, though the number of sales has declined. The “IPO effect” may well be playing a role in keeping demand up, especially in the higher price segments where sales volumes have continued to increase..
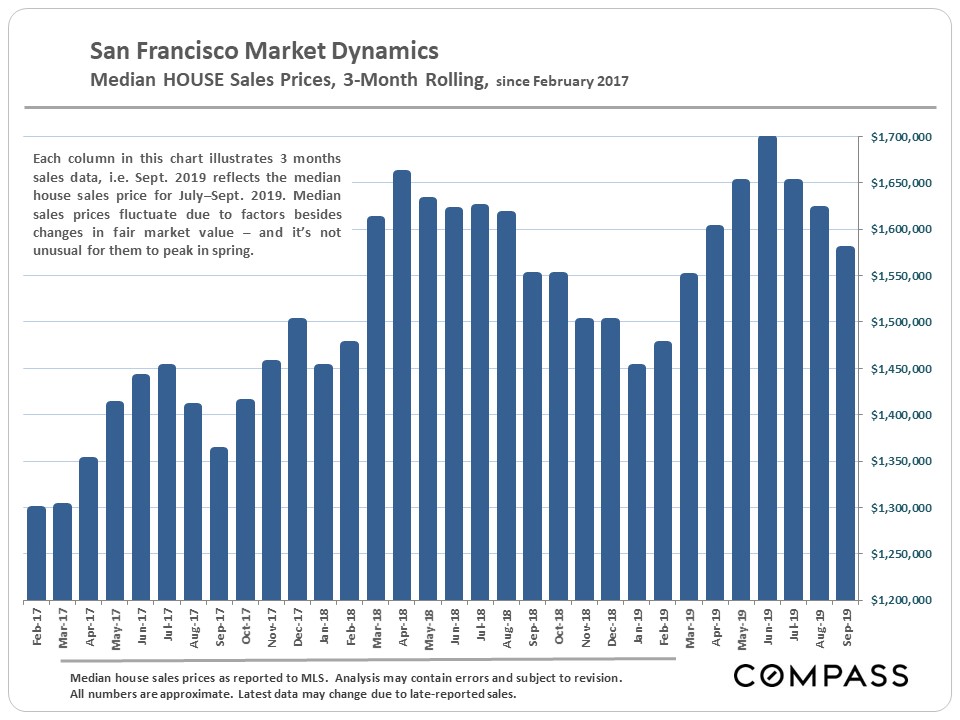
Median House Sales Price –
3-Month Rolling Figures
Median house sales prices hit a new high in spring, though the year-over-year increase was relatively modest. However, many Bay Area Counties have seen small declines in median home sales prices over the last 4 quarters.
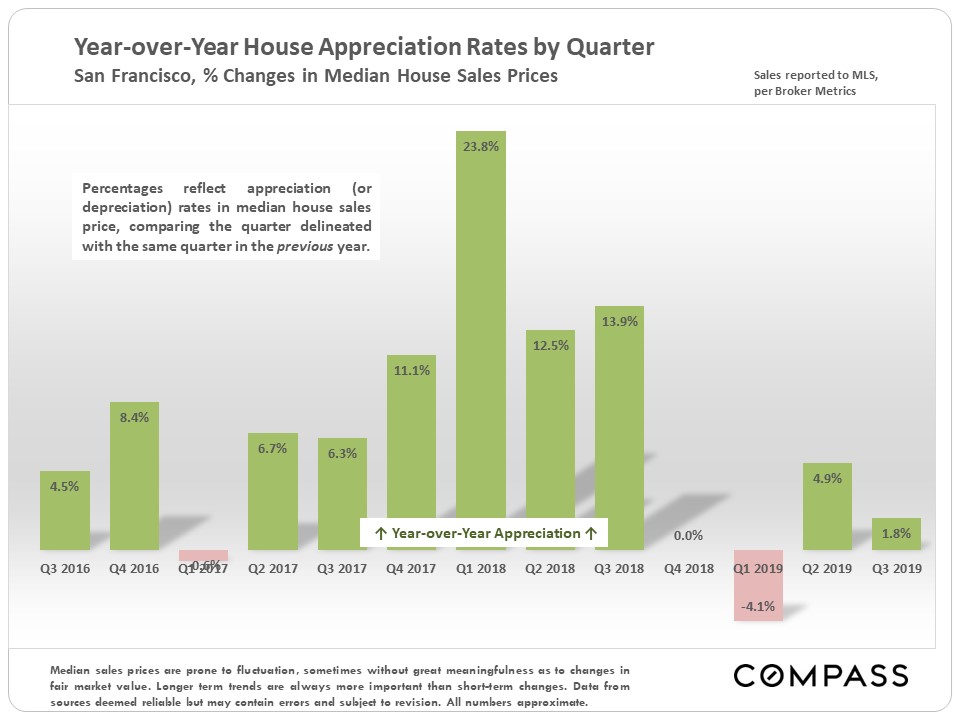
Year-over-Year, Quarterly Median House
Sales Price Percentage Change
Generally speaking, San Francisco is seeing significantly better year-over-year home price appreciation rates over the past 2 quarters than most Bay Area Counties, but the increases are well down from those seen during much of the recovery since 2012.
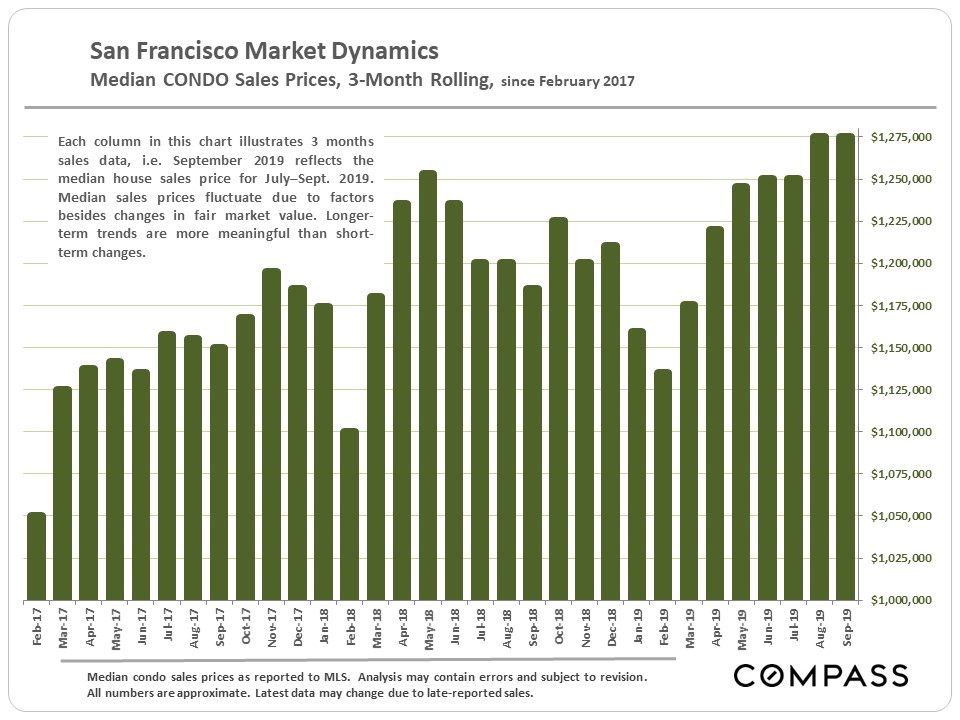
Median Condo Sales Price –
3-Month Rolling Figures
Median condo sales prices have hit new highs, but the apples-to-apples appreciation issue is complicated by the thousands of new condos that have come on market, many of which have been at higher price points.
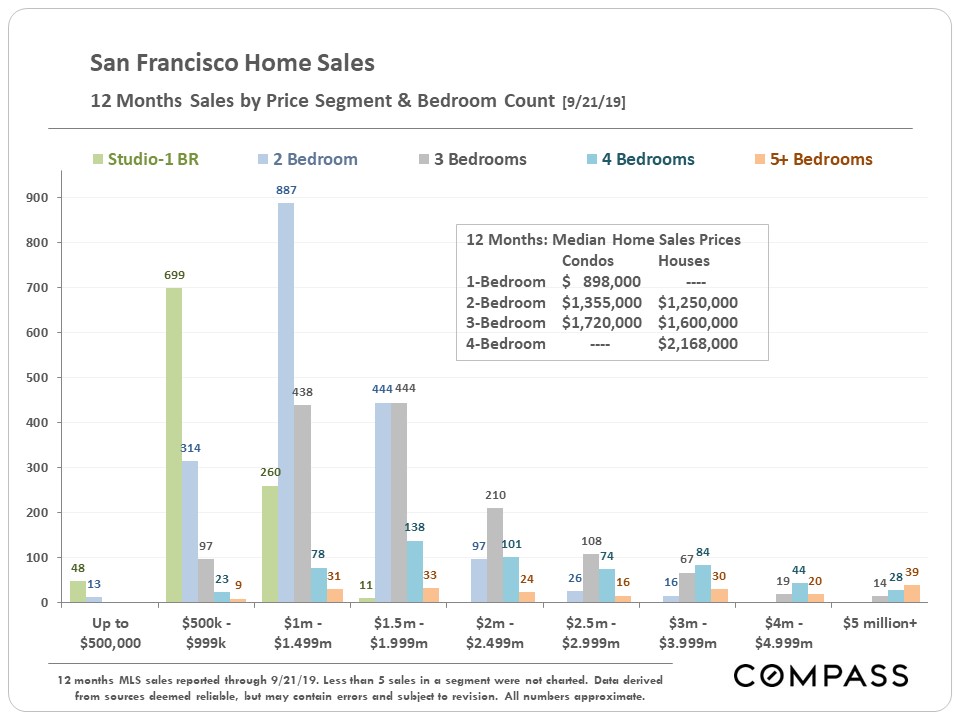
San Francisco Home Sales
by Price Segment & Bedroom Count
The most common sale in San Francisco is that of a 2-bedroom condo selling between $1,000,000 and $1,500,000. 2 & 3 bedroom condos now have higher median sales prices than 2 & 3 bedroom houses. This is due to 2 issues: 1) the tens of thousands of newly built, higher-price (often high-rise) condos coming on market in the last 15 years, and 2) condos are commonly found in more expensive neighborhoods than those where most house sales occur.
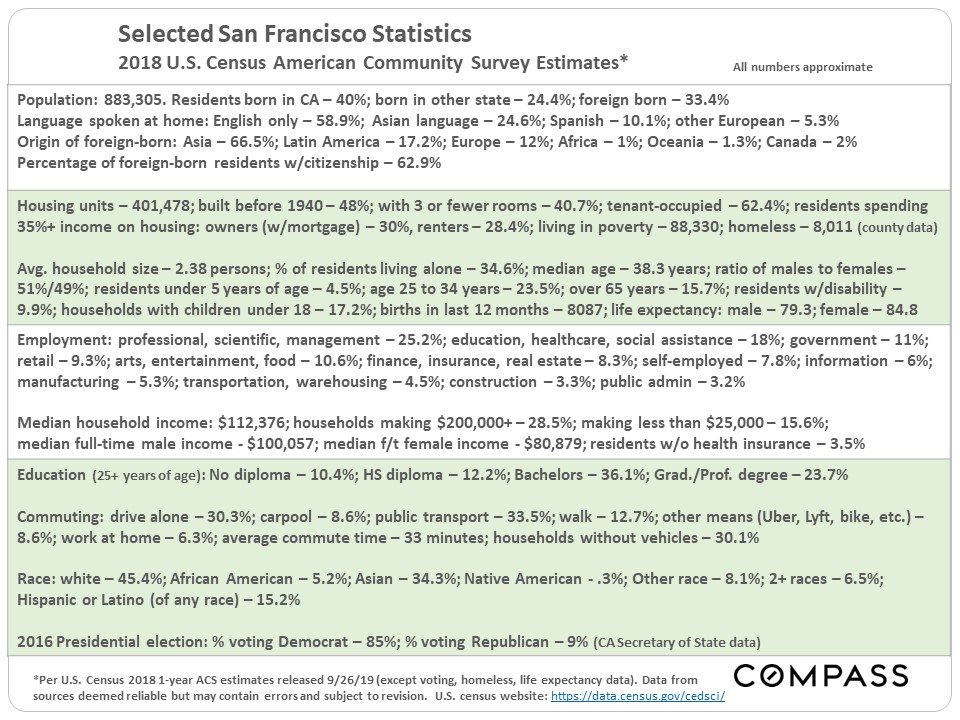
Updated Census Statistics
Underlying the real estate market are the changing details and circumstances of its population. At the end of September, the U.S. Census released its 2018 American Community Survey 1-year data estimates for a broad range of economic, social and demographic statistics. Below is a selection of survey insights into our community, plus 2 or 3 statistics from other sources. (You may want to expand this slide for easier reading.)
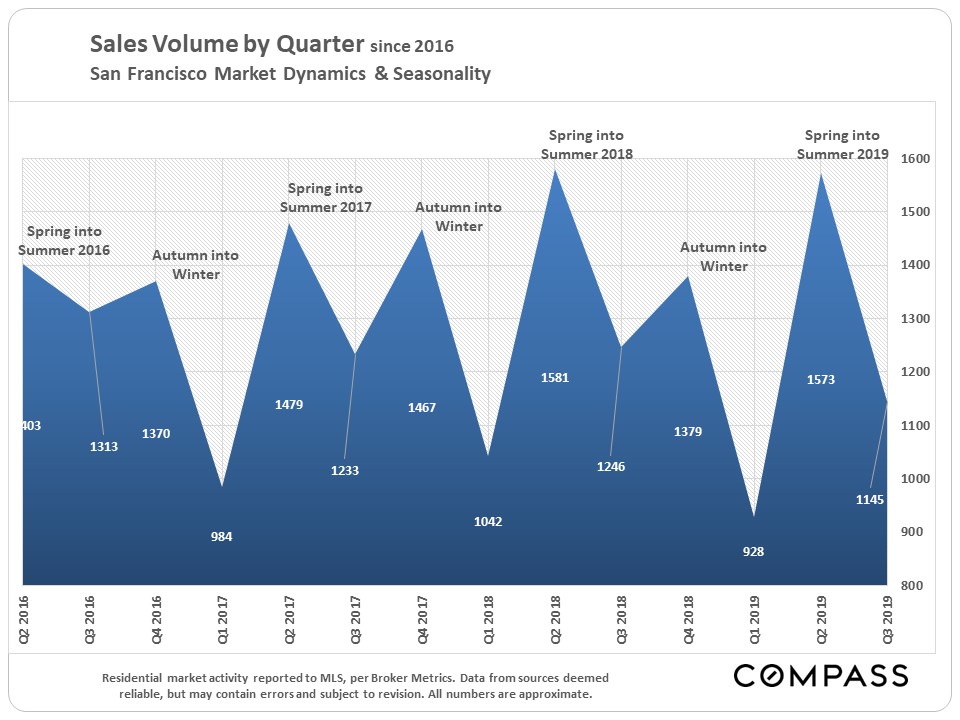
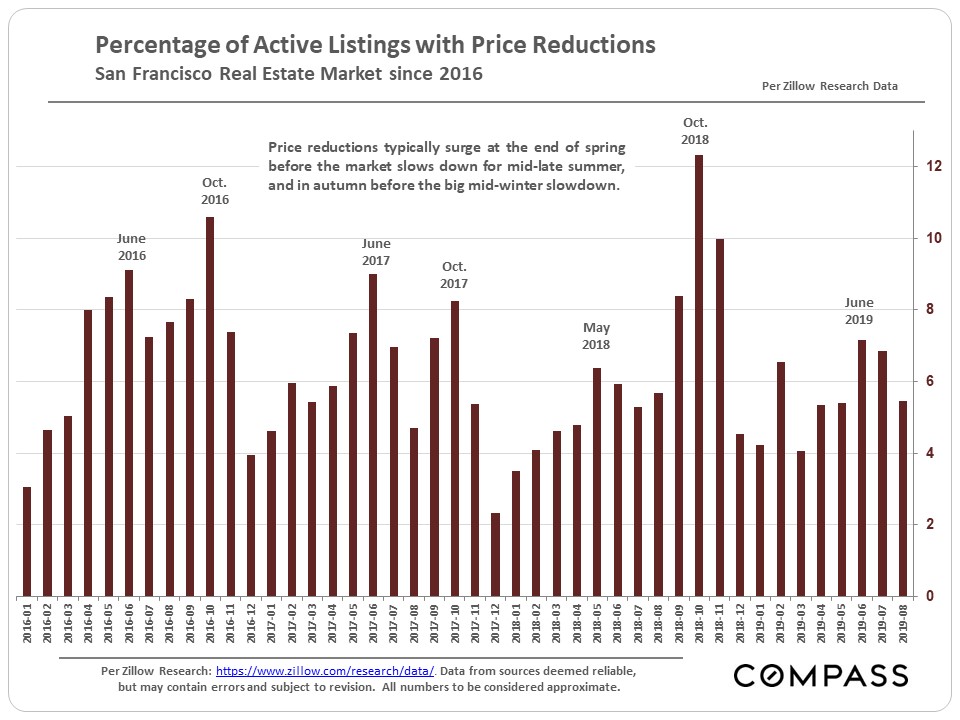
Luxury Home Sales
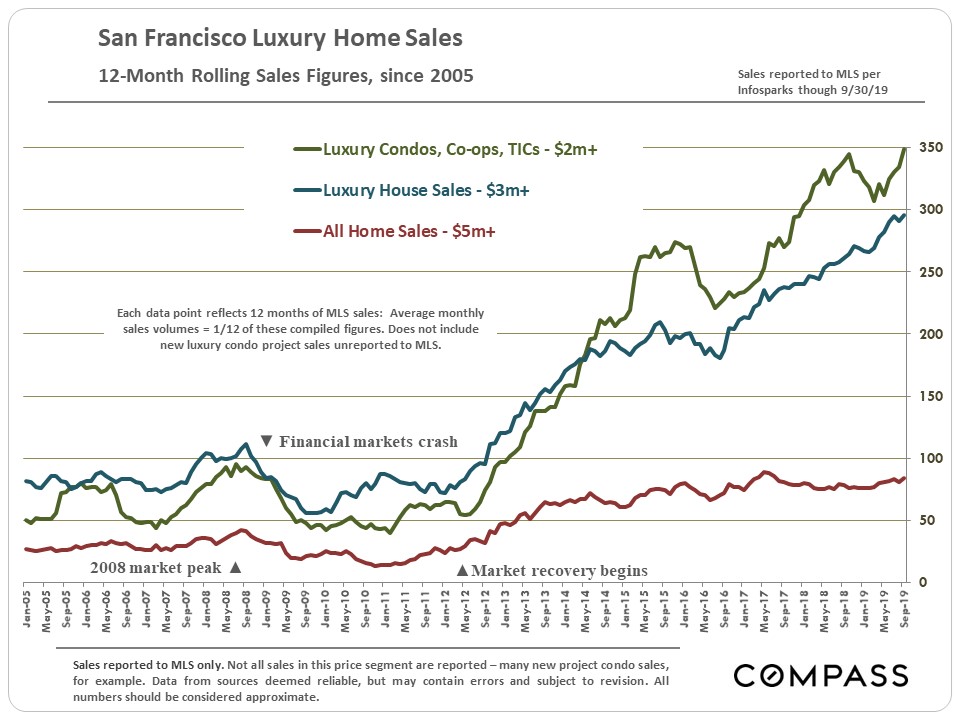
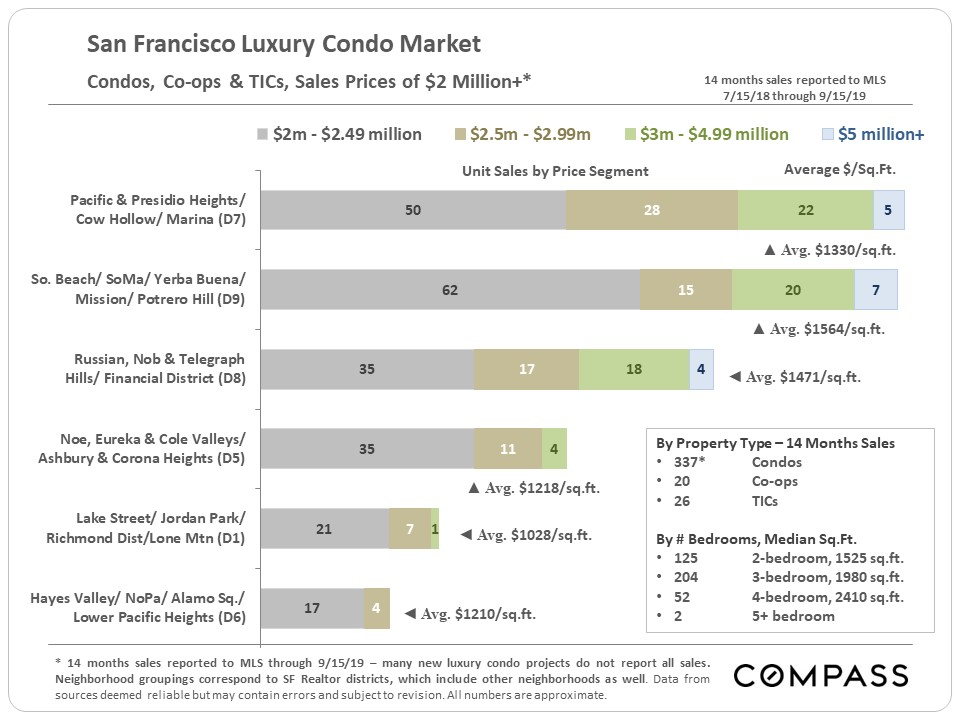
Sales Volumes & Price Reductions
Looking forward, October is typically both a big month for closed sales, reflecting the surge in deals after September’s big spike in new listings, as well as for price reductions, as sellers of unsold homes try to spark renewed buyer interest before the market slows in mid-November for the winter holidays.
Then in December, many sellers pull their unsold listings off the market altogether to wait for the market to wake up again in January-March. Of course, sales occur in every month of the year, and indeed, slower periods can be advantageous to buyers since competition for listings plunges.
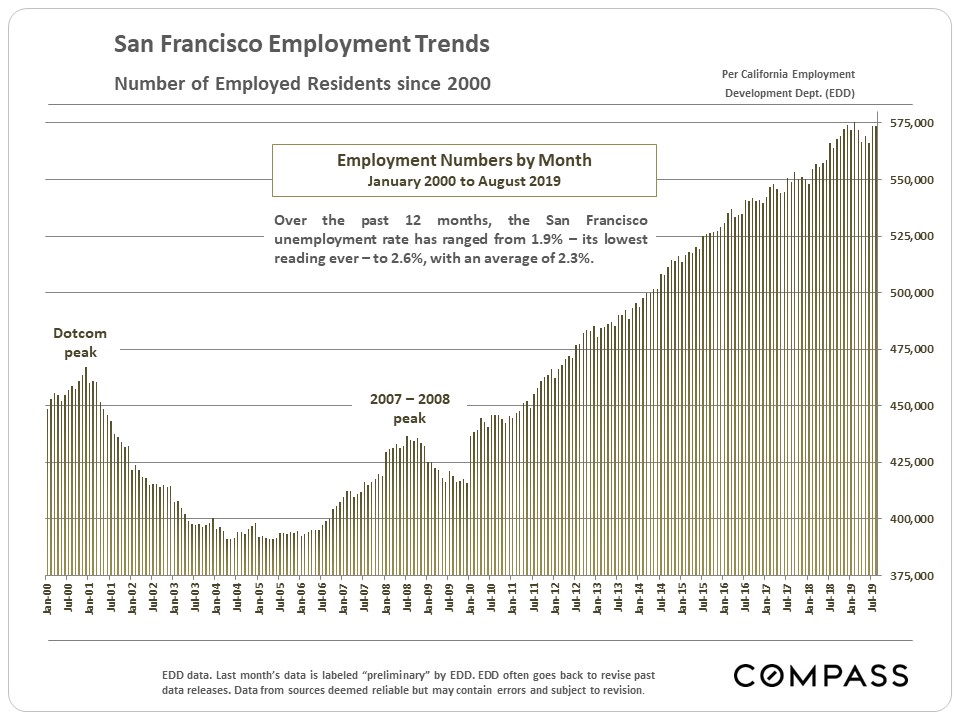
SF Employment Trends
Behind the story of home price appreciation since 2000 are the ups and down in the number of employed residents. After a spectacular boom in job creation since 2010 – many of the jobs extremely well paid – the number has generally leveled off in the past year (according to the CA Employment Development Department).
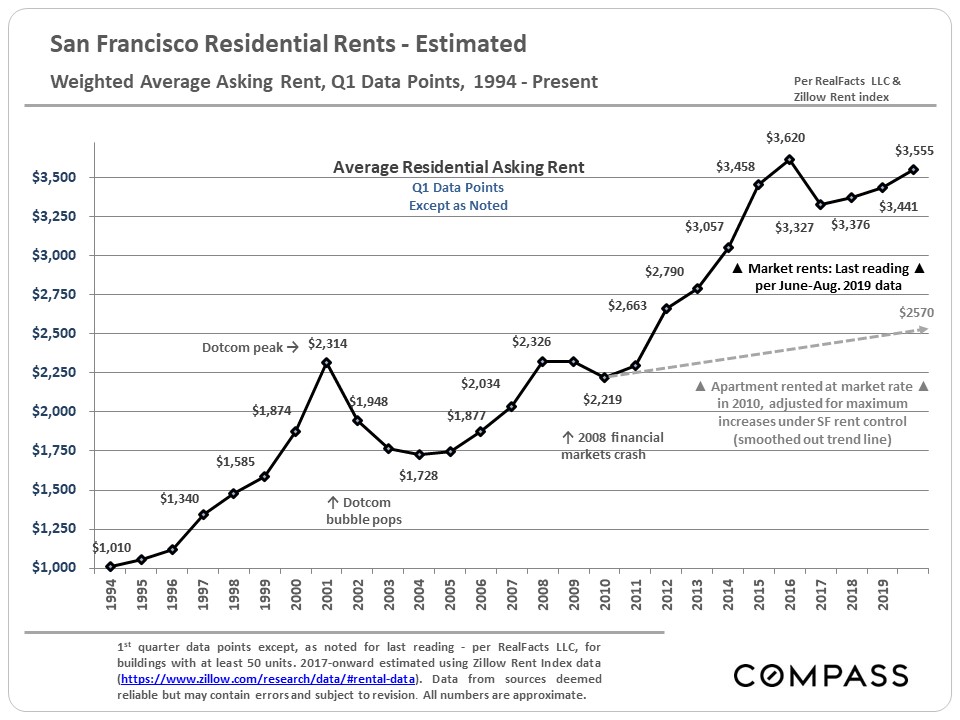
Trends in Rents
The 2 big recent factors in rent rates have been changes in employment numbers, and the increase in the supply of apartments on the market due to the boom in rental unit construction (the first such boom in many decades). Economists believe there should be generally parallel trends in rents and ownership costs, those being the 2 housing options (besides living with one’s parents).
The dotted line delineates the approximate divergence in rents between a market rate unit and a rent-controlled apartment leased in 2010.
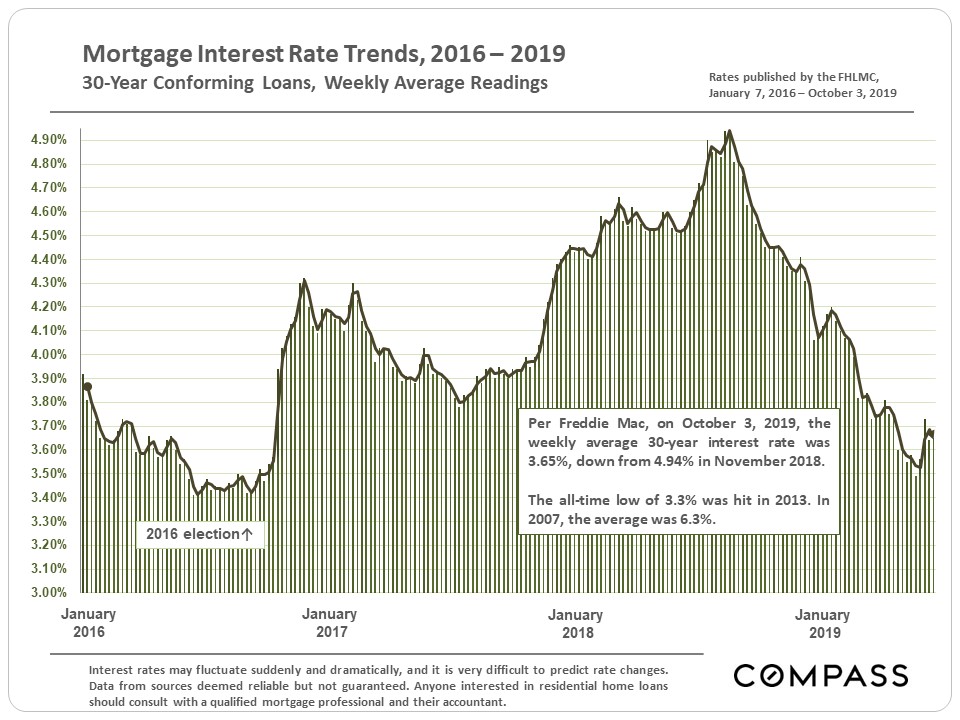
Mortgage Interest Rates
A year ago, many experts predicted that interest rates in 2019 would average in the 5.5% range, but they plummeted instead, a major dynamic in this year’s market. Buyers generally saw big drops in homeownership costs as compared to late 2018. If you are already a homeowner, depending on when you purchased your home, you might want to investigate the option of refinancing your mortgage with a new, long-term, fixed-rate loan. Note: Historically, it has been very difficult to predict interest rate movements.

Jeff Salgado
DRE#: 01501886
415.915.9916
jeff(at)jeffsalgado(dotted)com
© Compass 2018 ¦ All Rights Reserved by Compass ¦ Made in NYC
Compass is a licensed real estate broker (01991628) in the State of California and abides by Equal Housing Opportunity laws. All material presented herein is intended for informational purposes only. Information is compiled from sources deemed reliable but is subject to errors, omissions, changes in price, condition, sale, or withdraw without notice. No statement is made as to accuracy of any description. All measurements and square footages are approximate. Exact dimensions can be obtained by retaining the services of an architect or engineer. This is not intended to solicit property already listed